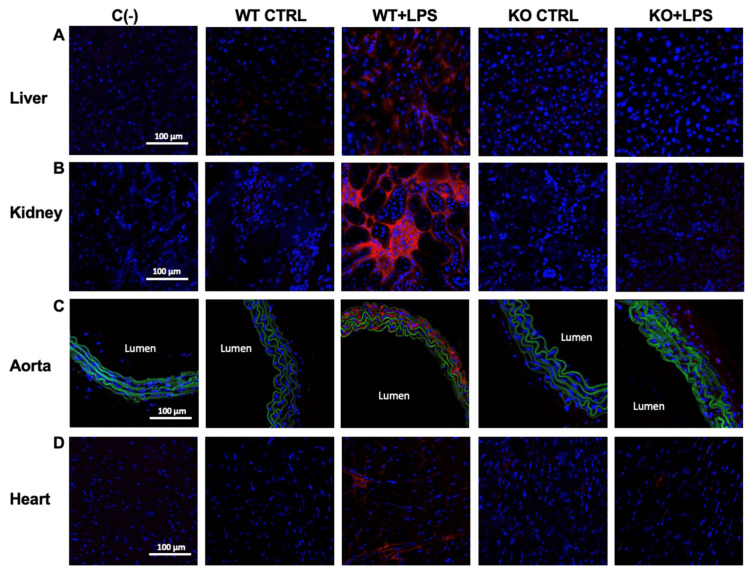
Figure 4.
Immunohistochemical analysis of inducible COX (COX-2; red fluorescence) in liver (A), kidney (B), aorta (C), and heart (D) from untreated (saline solution) Aqp9+/+ or Aqp9−/− mice (WT CTRL and KO CTRL, respectively) or LPS-treated (40 mg/kg) WT or KO mice (WT+LPS and KO+LPS, respectively) (four animals/group), 6 h after the i.p. injection. The green fluorescence seen in aortas corresponds to elastin autofluorescence. Cell nuclei were stained by DAPI (blue fluorescence). C(−), negative controls (no primary antibody).

