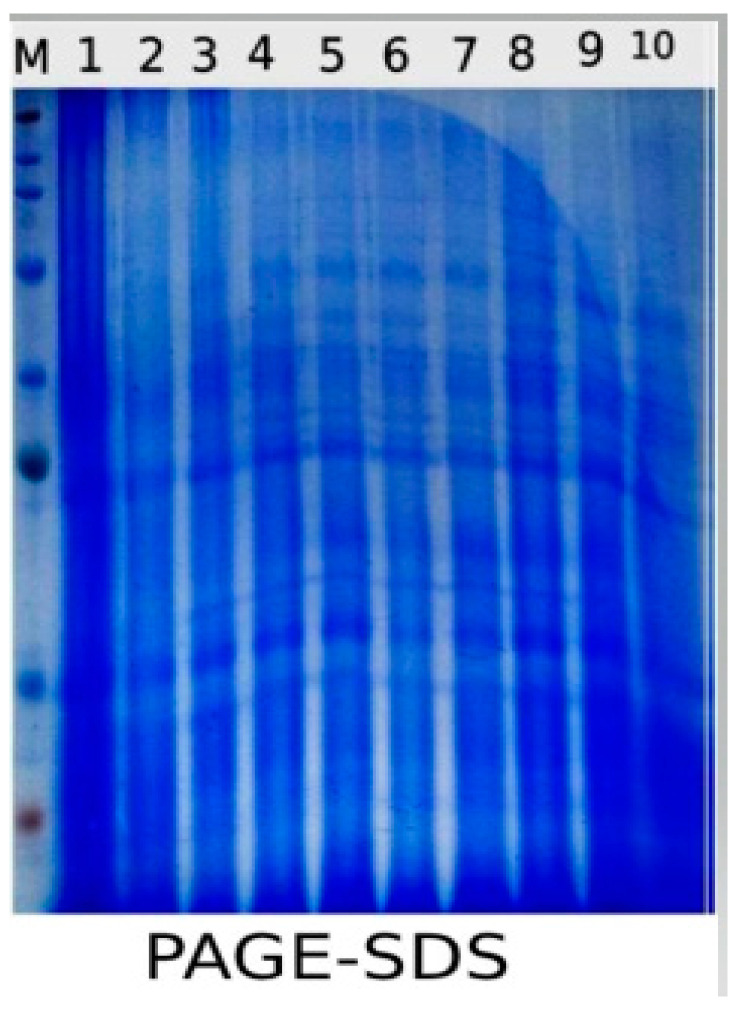
Figure 10.
Effect of salinity (S) and foliar application of chitosan dissolved in different organic acids (Ch ACE, Ch ASC, Ch CIT and Ch MAL) and their interactions on Protein electrophoretic banding patterns of tomato leaves. L1 = Control, L2 = Ch ACE, L3 = Ch ASC, L4 = Ch CIT, L5 = Ch MAL, L6 = S, L7 = S + Ch ACE, L8 = S + Ch ASC, L9 = S + Ch CIT and L10 = S + Ch MAL.

