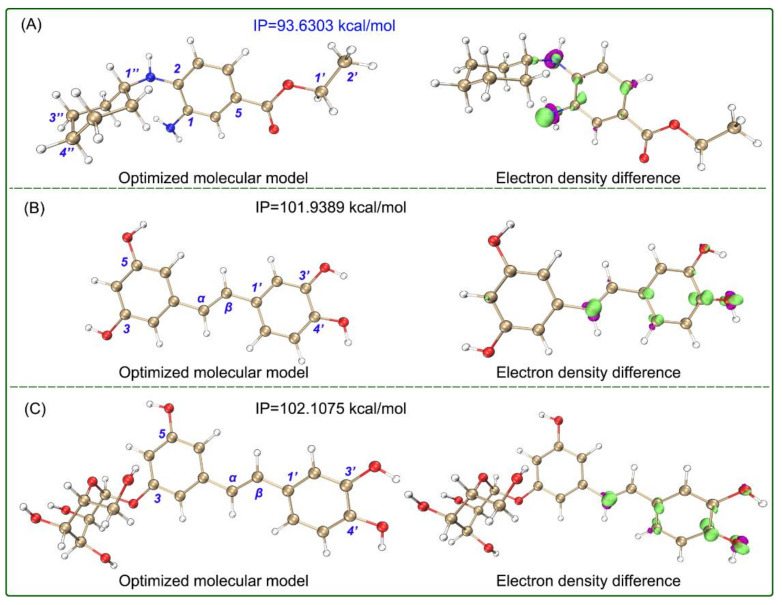
Figure 4.
Optimized molecular model with IP value and isosurface map of electron density difference between neutral molecules and cationic radicals (A, Fer-1; B, piceatannol; C, astringin) in the aqueous SMD solvation model. The calculations were based on M06-2X-D3/6-311+G** and M06-2X-D3/def2-TZVPD calculation levels. In the isosurface map, lime and purple colors correspond to the regions where the electron density increased and decreased, respectively (isovalue = 0.008). The Cartesian coordinates and energies of the optimized neutral molecules are listed in Supplementary Material 2.

