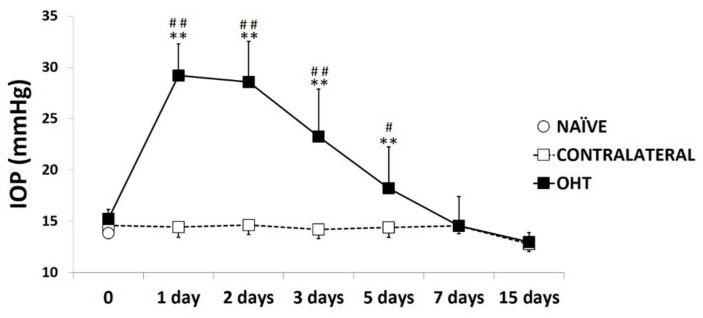
Figure 1.
Intraocular pressure (IOP) values at different times after laser-induced ocular hypertension (OHT). Variation over time in intraocular pressure IOP values after OHT induction. Points show the mean levels (±SD) of IOP previously and at 1, 2, 3, 5, 7, and 15 days after laser OHT induction in naïve eyes, ocular hypertension eyes (OHT), and contralateral eyes. Statistical significance indicators: ** p < 0.01 vs. naïve; ## p < 0.01 vs. contralateral; # p < 0.05 vs. contralateral.

