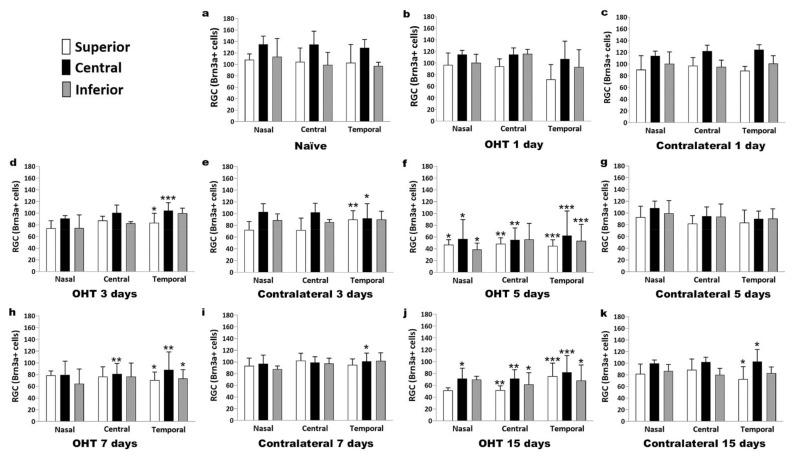
Figure 13.
The variation over space and time in the number of Brn3a+ cells in the immunohistochemical assay. The histograms show the mean levels (±SD) of Brn3a+ cells at days 1, 3, 5, 7, and 15 after laser OHT induction. (a) Control naïve eyes; (b,d,f,h,j) ocular hypertension eyes (OHT); (c,e,g,i,k) contralateral eyes. In each region and zone of the retina: nasal‒superior, nasal‒central, nasal‒inferior; central‒superior, central‒central, central‒inferior; and temporal‒superior, temporal‒central, temporal‒inferior. Statistical significance indicators: * p < 0.05, ** p < 0.01, *** p < 0.005, OHT vs. control naïve. Abbreviations: RGCs (retinal ganglion cells); Brn3a (brain-specific homeobox/POU domain protein 3A); OHT (ocular hypertension).

