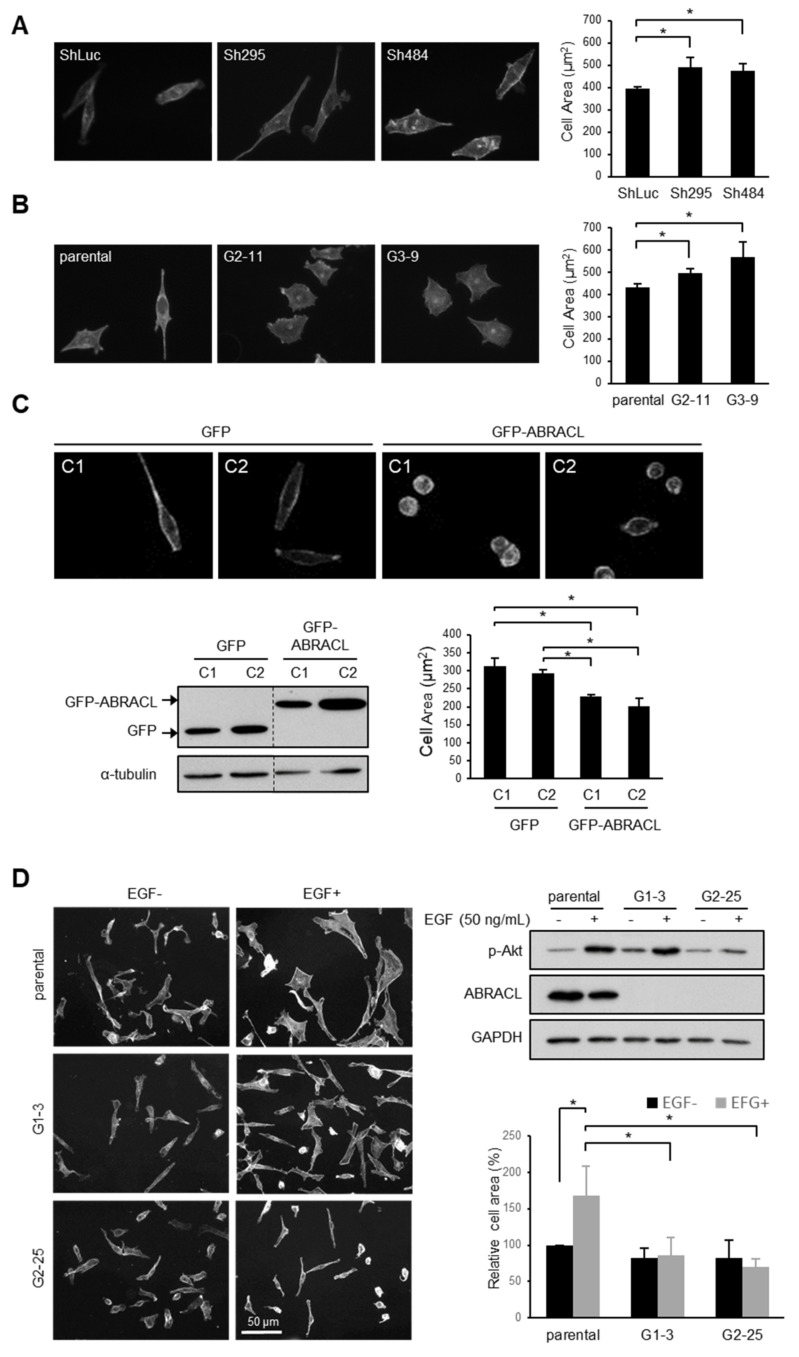
Figure 3.
ABRACL expression influences cell morphology. (A–D) Fluorescence staining and morphology analysis on cells expressing different levels of ABRACL. Cells were fixed and stained for F-actin using TRITC-phalloidin; representative fluorescence micrographs are shown. Microscopic images were captured and subjected to computer-assisted image analysis to calculate the average cell area. Mean ± SD from at least 3 independent experiments are shown; *, p < 0.05. (A) Control (ShLuc) or ABRACL-knockdown (Sh295 and Sh484) stable clones of HCT116 cells. (B) Parental or ABRACL-knockout (G2-11 and G3-9) HCT116 cells. (C) GFP- or GFP-ABRACL-expressing SW620 clones. Western analysis on these clones is also shown. (D) Parental and ABRACL-knockout (G1-3, G2-25) MDA-MB-231 cells were serum-starved for 16 h and then treated with 50 ng/mL EGF or not for 30 min before analysis. Western analysis on these cells is also shown; the increased p-Akt level demonstrates the effect of EGF.

