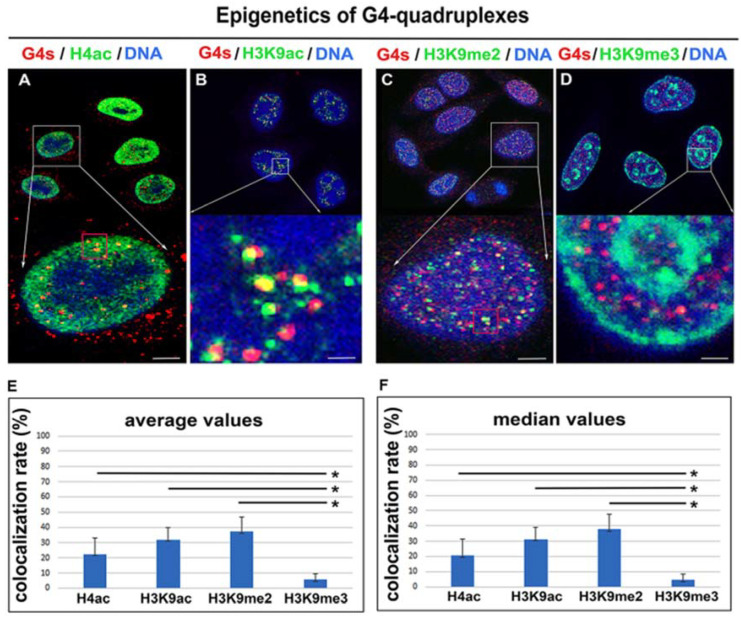
Figure 3.
Histone signature of G4 structures in HeLa cells. (A) G4s (red) structures were associated with acetylated histones H4 (green). (B) G4s (red) and H3K9ac (green). (C) G4s (red) and H3K9me2 (green). (D) G4s (red) and H3K9me3 (green). DAPI (blue) was used as a counterstaining of the cell nucleus. Scale bars represent 3 µm in panels A, C and 1 μm in panels B, D. Arrows show enlarged selected cells or selected regions inside cell nuclei. Panels show the rate of colocalization between G4s and H4ac, G4s and H3K9ac, G4s and H3K9me2, G4s and H3K9me3. Panel (E) illustrates data documenting colocalization rate and its average values. Panel (F) shows the colocalization rate in terms of median values. Data are presented as a colocalization rate with standard errors (S.E.). The normality test (Shapiro–Wilk) passed for comparison of G4s/H4ac and G4s/H3K9me3. In this case, the difference in the mean values of the two groups was greater than would be expected by chance; there is a statistically significant difference between the input groups (p ≤ 0.001). The Student’s t-test revealed statistically significant differences, as indicated by asterisks (*). As reference values, the colocalization rates of G4s/H3K9me3 were used. The normality test (Shapiro–Wilk) failed for H3K9ac (H3K9me2) and H3K9me3, but the Mann–Whitney rank sum test showed that the difference in the median values between the two groups was greater than would be expected by chance; there was a statistically significant difference (p ≤ 0.001).

