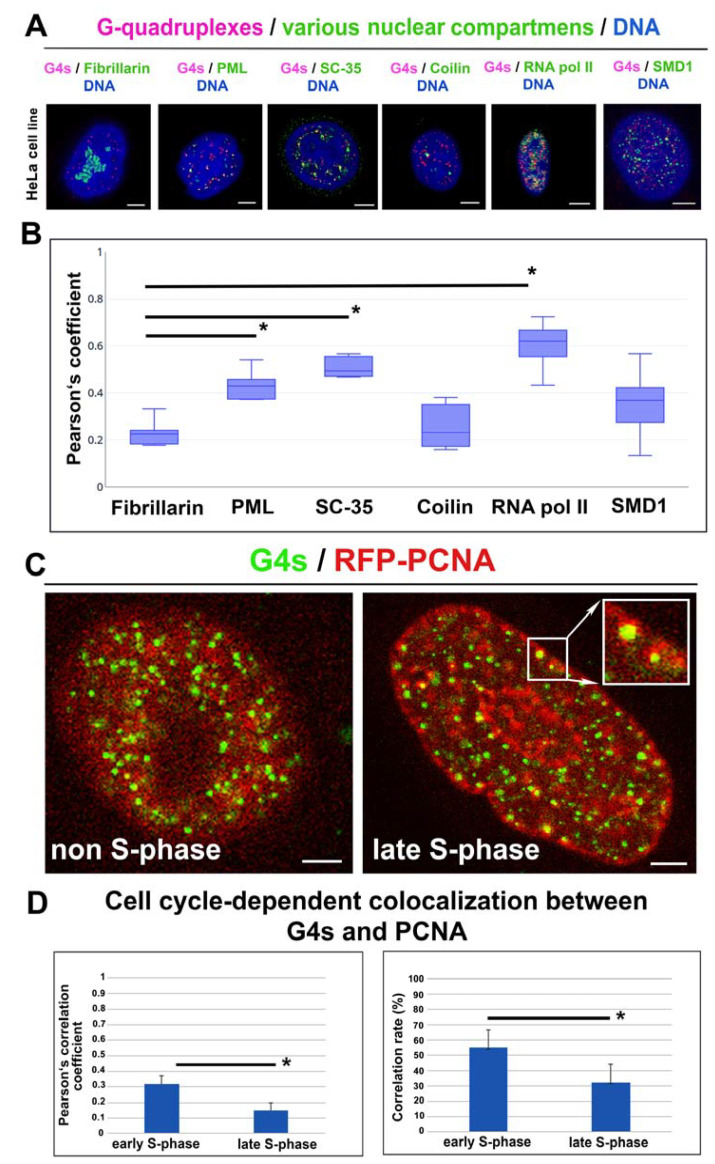
Figure 5.
The spatial relationship between G4s and nucleoli, PML bodies, SC35-positive nuclear speckles, Cajal bodies, RNAP II-positive transcription factories, and PCNA-positive replication foci. (A) The nuclear distribution pattern of G4s (red) and fibrillarin (green), PML nuclear bodies (green), the SC35 protein (green), the coilin protein (green), phosphorylated form of RNAP II (green), and the SMD1 protein is shown. (B) Analysis of a degree of colocalization between G4s and nuclear compartments. In the cases indicated by an asterisk (*), the equal variance test (Brown–Forsythe) passed, similarly, the normality test (Shapiro–Wilk), so that the Student’s t-test showed the difference in the mean values of the two groups as greater than would be expected by chance; there is a statistically significant difference between the input groups (p ≤ 0.001). As a reference, the Pearson’s correlation coefficient was used for those observed for G4s and fibrillarin. Bars show the lowest and highest level of the Pearson’s correlation coefficient. Data in panel B represent the median of the Pearson’s correlation coefficient with minimal and maximal values. (C) The reciprocal link between G4s and PCNA-positive foci in non-S phase cells and the late S-phase of the cell cycle. Data originate from 30–40 nuclei analyzed for each experimental event. In panel (D), the Mann–Whitney U test was used for the statistical analysis, showing differences between G4s colocalization with PCNA-positive replication foci in the early S-phase and the late S-phase of the cell cycle. Asterisks indicate statistically significant differences at α = 0.05.

