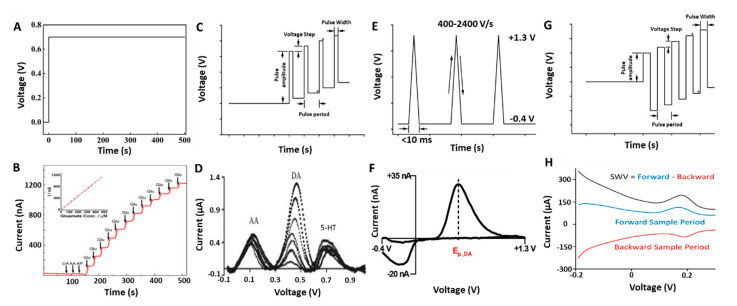
Figure 1.
(A) Waveform of CA at a biased voltage of +0.7 V. (B) Current response of a Pt/PPy/MWCNT/glutamate oxidase electrode to 250 µM acetaminophen (AP), UA, AA, and successive injections of 20 µM Glu. Adapted with permission from [63]. (C) Waveform of DPV, indicating the current measurement periods. (D) Baseline-corrected DPV of a mixture of 1 mM AA, 10 µM 5-HT, and 0.1–10 µM DA from a carbon nanofiber electrode. Adapted with permission from [44]. (E) Waveform of FSCV between −0.4 and +1.3 V. (F) A background-subtracted DA signal from a CFM. Adapted with permission from [64]. (G) Waveform of SWV, indicating the current measurement periods. (H) SWV measurement of a 1 μM DA (black), forward (blue) and reverse (red) current responses. Adapted with permission from [25].

