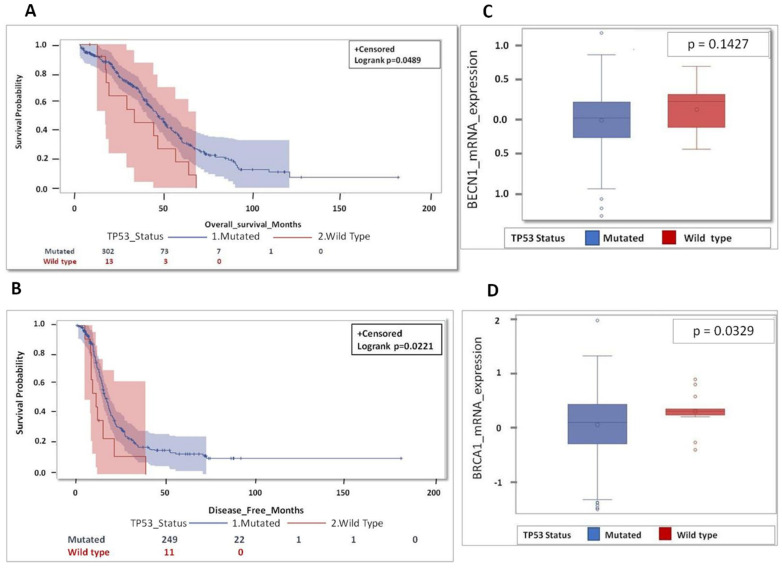
Figure 2.
Patients bearing a TP53-mutated tumor show better prognosis compared to TP53 wild type. (A) Overall survival for HGSOC patients according TP53 status. (B) Disease-free survival (DFS) for HGSOC patients according TP53 status. (C) Box-plot showing the distribution of BECN1 expression according TP53 status. (D) Box-plot showing the distribution of BRCA1 expression according TP53 status. (Note that for OS data were not available for 1 patient (mutated group 1 pt: 302 pt’s total n = 303 mutated pt’s) while for DFS data were missing for 56 patients (mutated group 54 pt: 249 pt’s+ wild type group 2 pt’s: 11 pt’s; total n = 316 pt’s), respectively).

