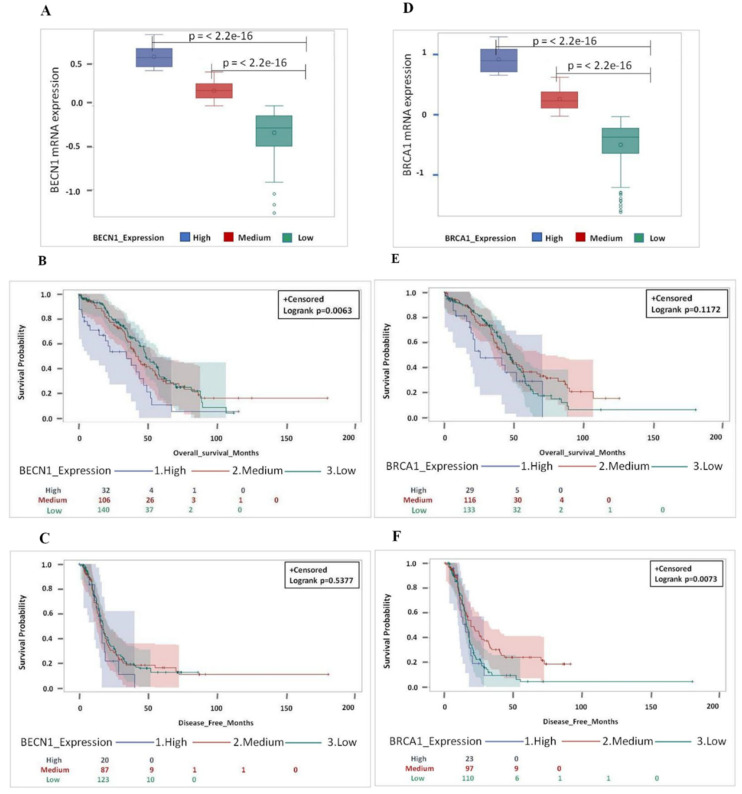
Figure 6.
Low expression of both BECN1 and BRCA1 independently gives better and longer overall survival as well as disease-free survival in TP53-mutated patients. (A) Box-plot showing the distribution of BECN1 expression based on expression levels (high, medium and low). (B) Overall and (C) disease-free survival for HGSOC patients based on BECN1 expression levels (high, medium and low). (D) Box-plot showing the distribution of BRCA1 expression based on expression levels (high, medium and low). (E) Overall and (F) disease-free survival analysis for HGSOC patients based on BRCA1 expression levels (high, medium and low). (Note that for BECN1 OS data were not available for 1 patient (medium group 1 pt: 106 pt’s; medium group total n = 107 pt’s) while for BECN1—DFS data were missing for 49 patients (high group 12 pt’s: 20 pt’s + medium group 20 pt’s: 87 pt’s + low group 17 pt’s: 123 pt’s; total n = 279 pt’s), respectively. For BRCA1 - OS data were not available for 1 patient (low group 1 pt: 133 pt’s; low group total n = 134 pt’s) while for BRCA1-DFS data were missing for 49 patients (high group 6 pt’s: 23 pt’s + medium group 19 pt’s: 97 pt’s + low group 24 pt’s: 110 pt’s; total n = 279 pt’s), respectively).

