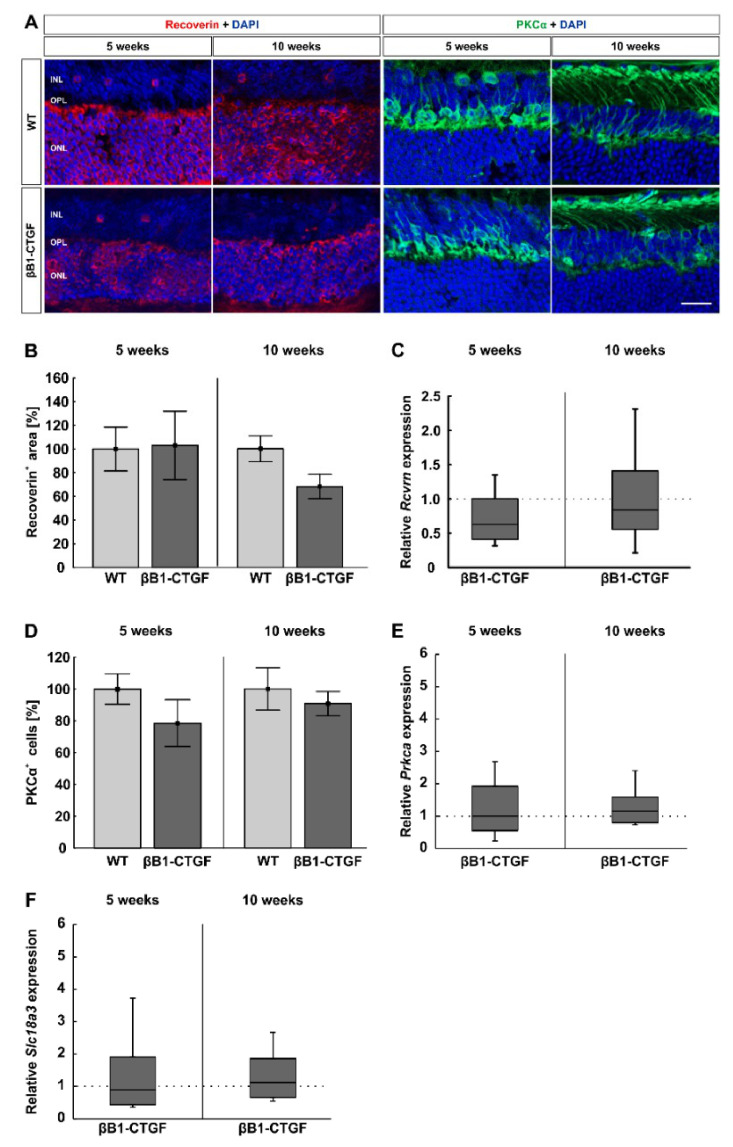
Figure 4.
No alterations in the number of bipolar cells. (A) Cone bipolar cells were evaluated by using recoverin (red) and rod bipolar cells using PKCα staining (green; n = 7–9/group). Cell nuclei were labeled with DAPI (blue). (B) The analysis of the recoverin+ area revealed no significant difference in staining area in βB1-CTGF animals at 5 weeks. At the age of 10 weeks, there was a trend towards smaller cone, bipolar cell areas in βB1-CTGF mice compared to in WT mice (p = 0.052). (C) The Rcvrn mRNA expression levels were comparable between βB1-CTGF and WT animals at both ages (n = 5–7/group). (D) PKCα+ cell numbers were not altered in βB1-CTGF retinae compared to in WT at 5 and 10 weeks. (E) RT-qPCR analyses of Prkca mRNA expression levels showed no alterations at 5 and 10 weeks of age. (F) Additionally, the mRNA levels of Slc18a3 (encoding for the vesicular acetylcholine transporter) were not altered in 5- and 10-week-old βB1-CTGF animals. Abbreviations: INL = inner nuclear layer, OPL = outer plexiform layer, ONL = outer nuclear layer. Values are mean ± SEM for immunohistology and median ± quartile + maximum/minimum for RT-qPCR. The dotted lines in C, E, and F represent the relative expression levels of the WT group. Scale bar: 20 µm.

