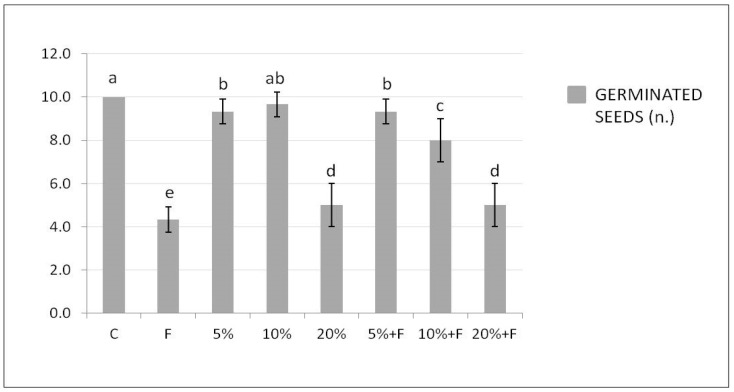
Figure 2.
Effect of DdC on tomato seed germination. Bars represent, in order from left to right: control soil untreated and not inoculated with the pathogen (C); soil inoculated with F. solani (F); soil treated with DdC at 5%; soil treated with DdC at 10%; soil treated with DdC at 20%; soil treated with DdC at different concentrations and inoculated with the pathogen (5% + F, 10% + F, and 20% + F). All data are expressed as the mean of three replicates ± SDs. Bars with different letters indicate mean values significantly different at p ≤ 0.01, according to two-way ANOVA combined with Tukey post hoc test.

