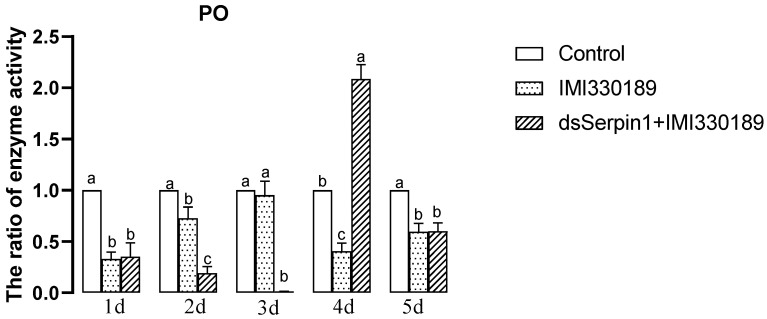
Figure 5.
The phenoloxidase (PO) activity of L. migratoria manilensis on the 3rd instars after the application of different treatments. Bars represent mean ± S.E. (n = 3). The letters a, b, and c denote the differences between treatments, bars labeled with different letters are significantly different (one-way ANOVA followed by Duncan’s test, p < 0.05).

