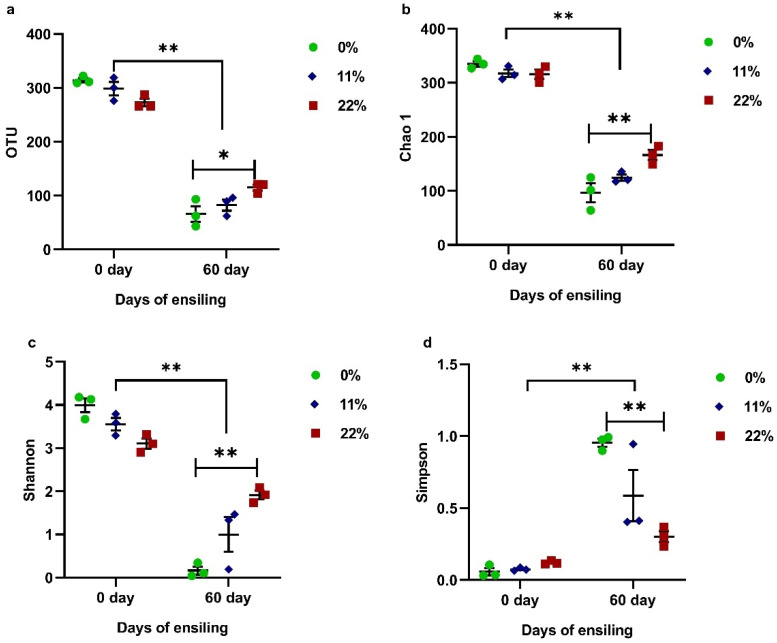
Figure 4.
Effect of the OS content on Operational Units (OTUs) (a), Chao 1 (b), and the Shannon (c) and Simpson (d) indexes in FTMR before and after 60 days of fermentation. 0, 0% oat silage; 11, 11% oat silage; 22%, 22, oat silage. Data were analyzed by two-way ANOVA. * indicates p < 0.05; ** indicates p < 0.01.

