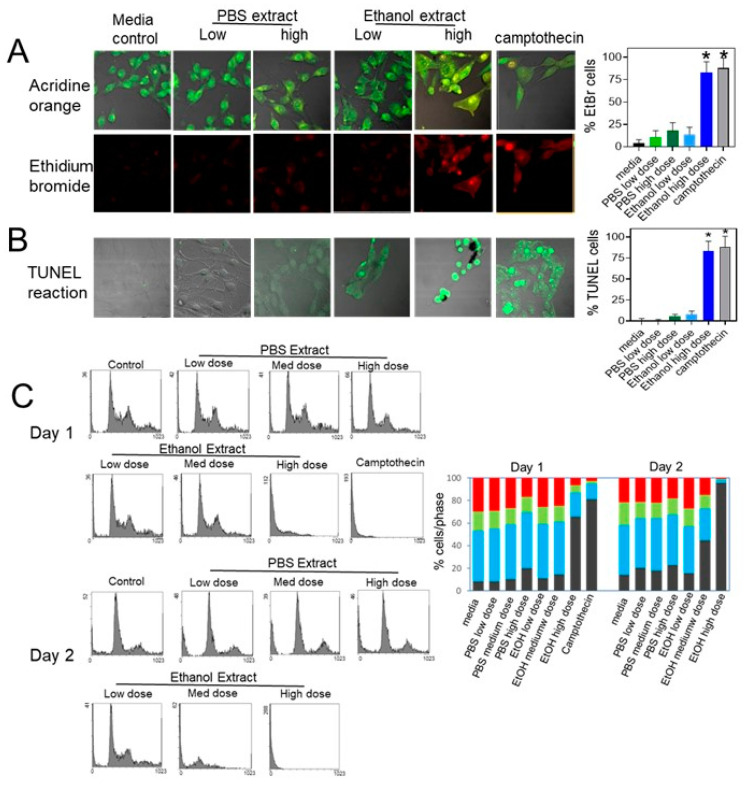
Figure 3.
Effect of Uncaria tomentosa extracts on the induction of apoptosis by the B16-BL6 cells. B16-BL6 cells were treated with culture media (control), or low (4 μg/mL), medium (40 μg/mL), or high doses (100 μg/mL) of Uncaria tomentosa extracted with 70% ethanol or PBS, or with 6 µg/mL Camptothecin (positive control): (A) fluorescence images were obtained for cells treated with Uncaria tomentosa extracts for 3 days and then stained with acridine orange (green) or ethidium bromide (red). The bar graph shows the % of cells stained with ethidium bromide; (B) cells treated for 2 days were stained by incubation with TUNEL reaction mixture to detect DNA fragmentation and the monolayers were analyzed using a fluorescence microscope and representative photos showing an overlay of the fluorescence channel (excitation at 488 nm and emission at 520 nm) and phase contrast channel are shown. The bar graph shows the % of cells that are positive for DNA fragmentation from three independent experiments. Differences from control were considered significant (*) when p ≤ 0.05 by a Tukey post hoc test; (C) flow cytometry of B16-BL6 cells treated with extracts of Uncaria tomentosa for 24 and 48 h and incubated with propidium iodide was used to determine the proportion of cells with a sub-G1 DNA concentration indicative of induction of apoptosis. The percentage of cells in the sub-G1 (black), G1 (blue), S (green) and G2 phases (red) are shown as the mean of three independent experiments.

