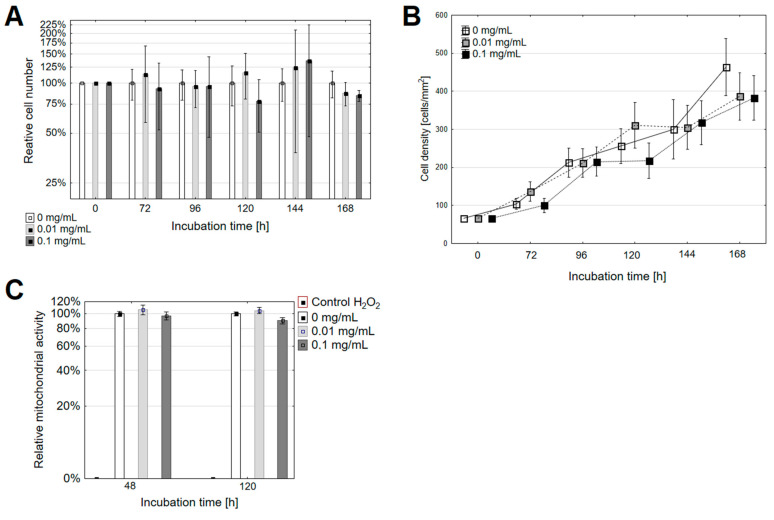
Figure 2.
The changes in the (A,B) proliferation and (C) mitochondrial activity in the PANC-1 cells after they had been treated with different concentrations of the fullerene nanomaterial. Error bars are presented as (A,B) SD or (C) SEM. The relative cell number indicates the cell number in the experimental group at the correct time point relative to the untreated cell number at the same timepoint.

