Figure 4.
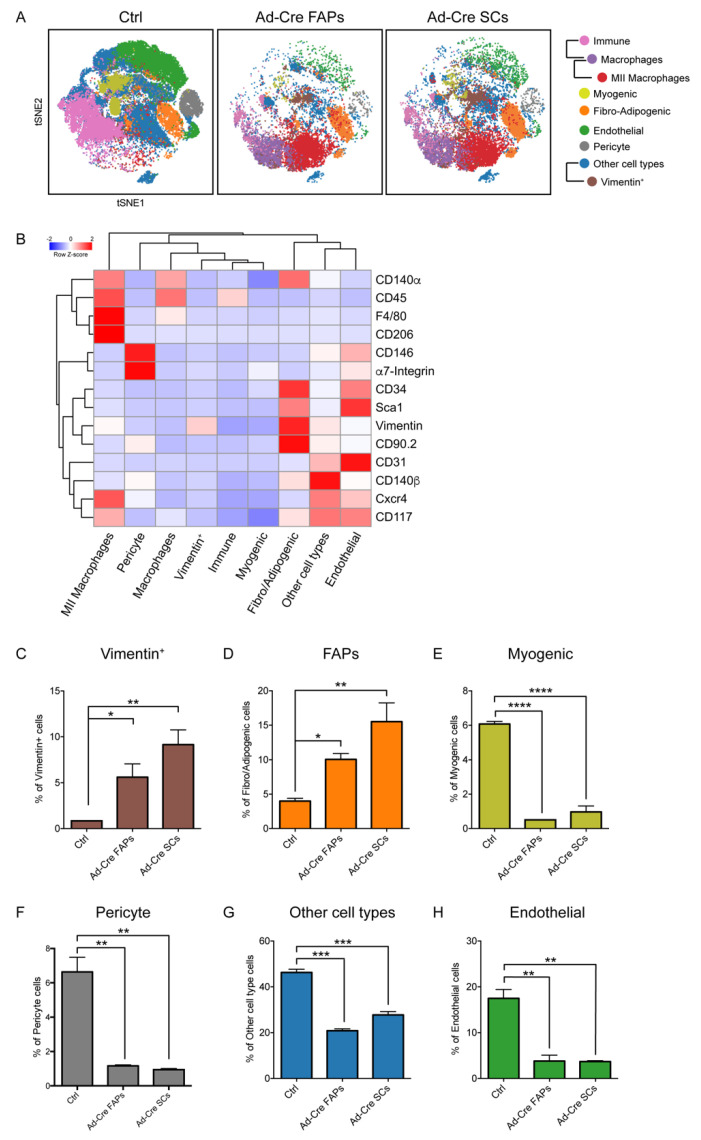
Mass-cytometry analysis of allograft tumors generated in NOD/SCID immunocompromised mice upon Ad-Cre FAP and Ad-Cre SC inoculation. (A) Variation in skeletal muscle-cell population abundance 3.5 weeks after the inoculation of Ad-Cre FAPs and Ad-Cre SCs into NOD/SCID mice. The dynamic changes are illustrated by representative density plots generated with the FlowSOM algorithm. (B) FlowSOM heatmap of column-normalized (z-score) marker expression for each of the identified clusters. Colors varied according to the expression level of the considered marker in a blue-to-red scale, indicating low to high expression, respectively. (C–H) The bar plots quantitate the variation in population abundance evaluated 3.5 weeks after cell inoculation. Cell percentages were assessed on the total number of cells in each sample (n = 2). The statistical significance was estimated by one-way ANOVA. All data are represented as mean ± SEM, and the statistical significance was defined as * p < 0.05; ** p < 0.001; *** p < 0.001; **** p < 0.0001.

