Figure 5.
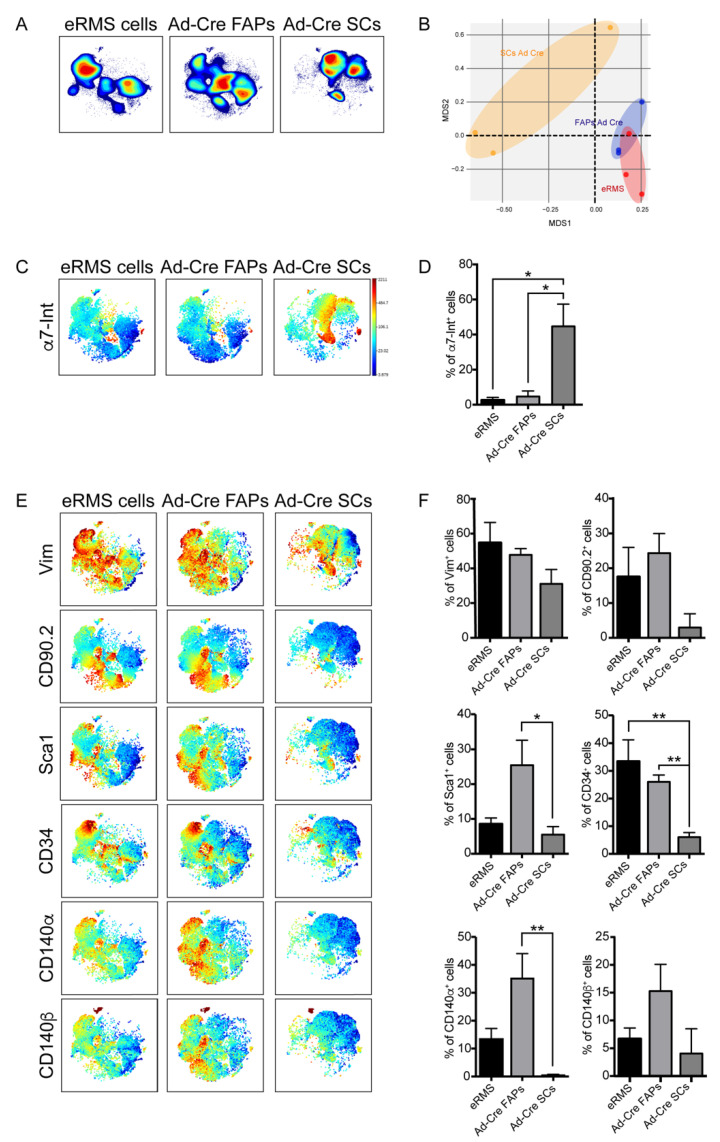
Mass cytometry antigenic-profile comparison of eRMS cells and Ad-Cre FAPs and Ad-Cre SCs. (A) Representative viSNE contour plots showing cell-density distribution of eRMS cells and Ad-Cre FAPs and Ad-Cre SCs (red: high density; blue: low density). (B) Multidimensional scaling plot (MDS) of eRMS, Ad-Cre FAPs and SCs. (C) Representative viSNE maps colored according to the expression level of α7-Integrin marker (blue: low expression; red: high expression). (D) The bar plots quantitate the percentage of cells positive for the expression of the α7-Integrin marker. (E) Representative viSNE maps showing the expression level of the indicated marker. (F) The bar plots quantitate the percentage of cells positive for the expression of the analyzed marker. (D,F) Cell percentages were assessed on the total number of cells in each sample (n = 3). The statistical significance was estimated by one-way ANOVA. All data are represented as mean ± SEM, and the statistical significance was defined as * p < 0.05; ** p < 0.01.

