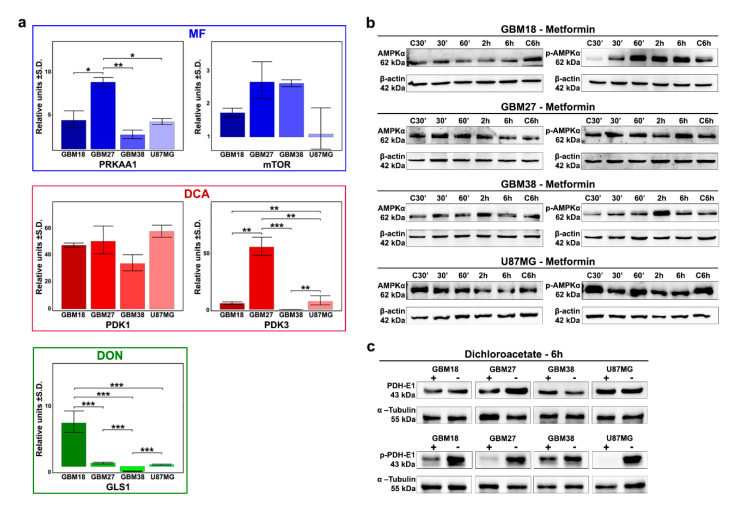
Figure 3.
(a) Expression profiles of target enzymes for our selection of metabolic drugs under basal conditions determined by RT-qRT-PCR. Representative results from a minimum of two replicates (n = 2). One-way ANOVA with Tukey correction. p < 0.05 *; p < 0.01 **; p < 0.001 ***. (b) Western Blot analysis at 30 min, 60 min, 2 h, 6 h after MF 72h-IC50 treatment for AMPKα and phospho-Thr172 AMPKα. (c) Western Blot analysis after 6 h of treatment with respective DCA 72h-IC50 doses for phospho-Ser293 PDH-E1 and total PDH-E1.

