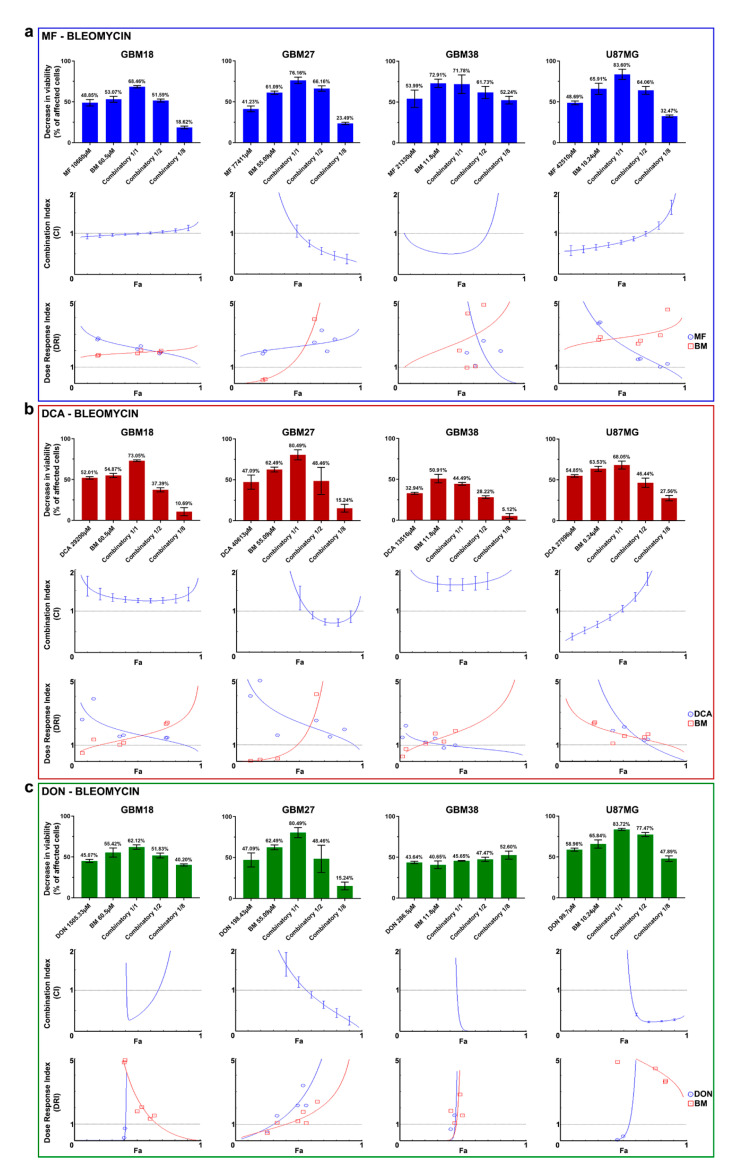
Figure 5.
(a–c) Combinatory drug studies between metabolic drugs (MF, DCA, DON) and bleomycin (BM). From top to bottom, three graphs for each cell line comprehensively describe synergy/antagonism. First graph: Bar charts of decrease in viability (% of affected cells) relative to control. Second graph: Combination index (CI) is given as a function of the fraction of affected cells (Fa) by the drug combination with a continuous line. The central dashed line indicates a CI = 1. According to the Chou-Talalay’s Combination Index Theorem, CI = 0.9 to 1.1 indicates an additive effect. CI < 1 is indicative of synergism, whereas CI > 1 indicates antagonism. The vertical bars indicate 95% confidence intervals for CI values based on Sequential Deletion Analysis (SDA); in some cases, SDA values cannot be graphed in CompuSyn software, but they were always calculated and are available in Supplementary File S1. Third graph: The Dose-Reduction Index (DRI) (also known as the Chou-Martin plot) signifies how many folds of dose-reduction for each drug at any given effect (Fa) are allowed in synergistic combination. In blue, metabolic drug DRI index; in red, bleomycin DRI index. DRI = 1 indicates no dose-reduction, DRI > 1 favorable dose-reduction and DRI < 1 no favorable dose-reduction. All experiments were performed in two biological replicates (n = 2).

