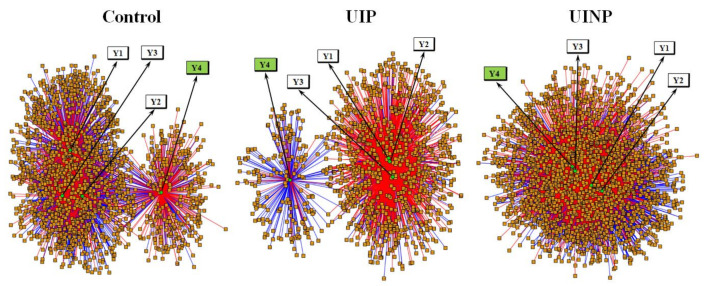
Figure 2.
Integrative and differential network analysis between metabolic profiles and anthropometrical data/FMP ratio in Control, UIP, and UINP. Control: control group; UIP: urinary incontinence with Pilates; UINP: urinary incontinence with no Pilates; Y1: body mass; Y2: BMI; Y3: body fat percentage; Y4: FMP ratio; green circular node: anthropometrical data and FMP ratio (Y1, Y2, Y3, and Y4); orange squared node: metabolic profiles; blue edge: negative correlation between node variables; red edge: positive correlation between node variables.

