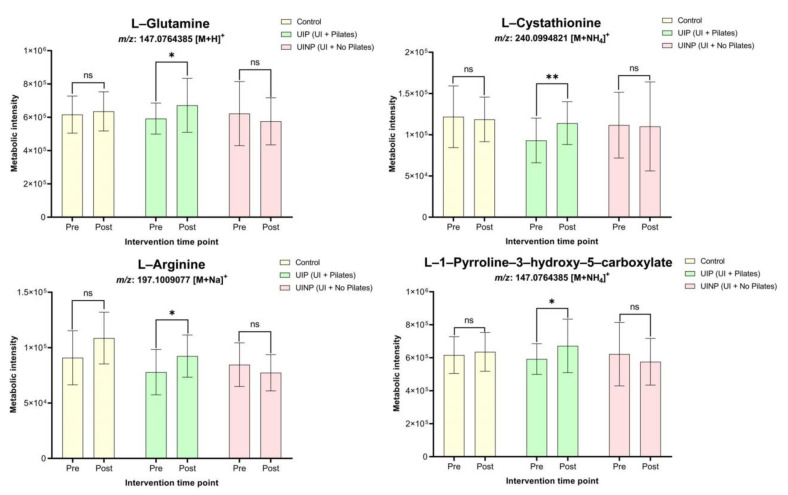
Figure 4.
Change in identified metabolic features associated with FMP ratio between pre- and post-intervention in Control, UIP, and UINP. Control: control group; UIP: urinary incontinence group with Pilates; UINP: urinary incontinence group with no Pilates; m/z: mass-to-charge ratio in ions that quantifies molecules in chemical or biological mixture. Pre: before 8-weeks intervention; post: after 8-weeks intervention. * (p < 0.05): significantly different from Pre. ** (p < 0.001): significantly different from Pre. ns means non-significant.

