Figure 1.
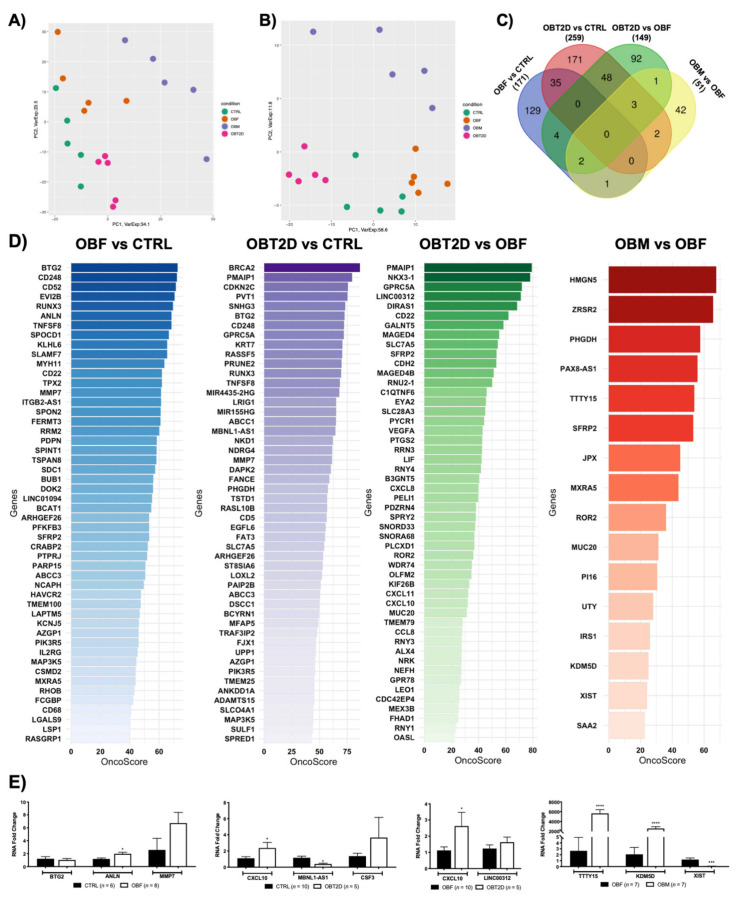
Transcriptome analysis highlights different expression profiles in SAT (Subcutaneous Adipose Tissue) of obese patients. Samples from 5 healthy, normal-weight women (CTRL), 5 obese women (OBF), 5 obese women with T2D (OBT2D) and 5 obese men (OBM) were obtained and four conditions (OBF vs. CTRL, OBT2D vs. CTRL, OBT2D vs. OBF and OBF vs. OBM) were analyzed. (A) Principal Component Analysis (PCA) of differentially expressed genes (DE RNAs) in the four conditions. (B) PCA of non-coding DE RNAs. (C) 171 DE RNAs were identified for OBF vs. CTRL, 259 DE RNAs were identified for OBT2D vs. CTRL, 149 DE RNAs were identified for OBT2D vs. OBF and 51 DE RNAs were identified for OBF vs. OBM. The Venn diagram displays how many genes are shared amongst conditions (http://bioinformatics.psb.ugent.be/webtools/Venn/, last accessed on 15 February 2021). (D) The OncoScore library was used to detect which genes, amongst the DE RNAs for each condition, were correlated with cancer. The y-axis represents the name of the DE RNAs related to cancer, the x-axis represents the OncoScore, and the color fades as the genes decrease in ranking. (E) mRNA expression levels were evaluated by Real-Time PCR in the different datasets for CTRL vs. OBF, CTRL vs. OBT2D, OBF vs. OBT2D and OBF vs. OBM. Data are expressed as mean ± SEM. The number of patients analyzed for each condition is reported in the figure. * p <0.05, **** p <0.0001 vs. the respective control condition.

