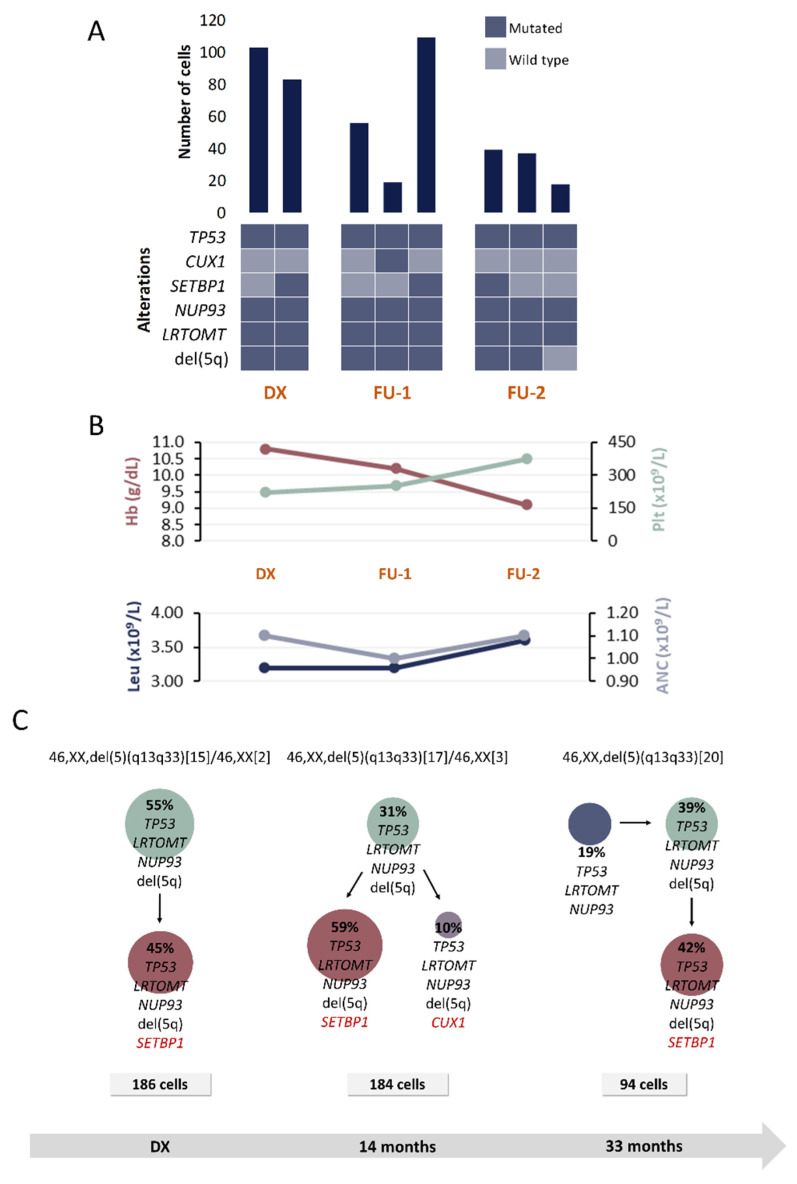
Figure 2.
Clinical and molecular characteristics of patient P1. (A) Bar plot depicts the number of cells with a given genotype for each clone that was detected at the moment of diagnosis (DX), 1st follow-up (FU-1) and 2nd follow-up (FU-2). Heatmap below the bars indicates the genotype for each clone: dark blue and light blue are used to indicate the mutated or wild-type state, respectively. (B) Hematological characteristics such as hemoglobin (Hb), platelet count (Plt), leukocyte count (Leu) and absolute neutrophil count (ANC) are indicated for each analyzed time point. (C) Proposed clonal architecture, karyotype and number of analyzed cells for each time point is indicated. Color red distinguishes new acquired alterations in each clone.

