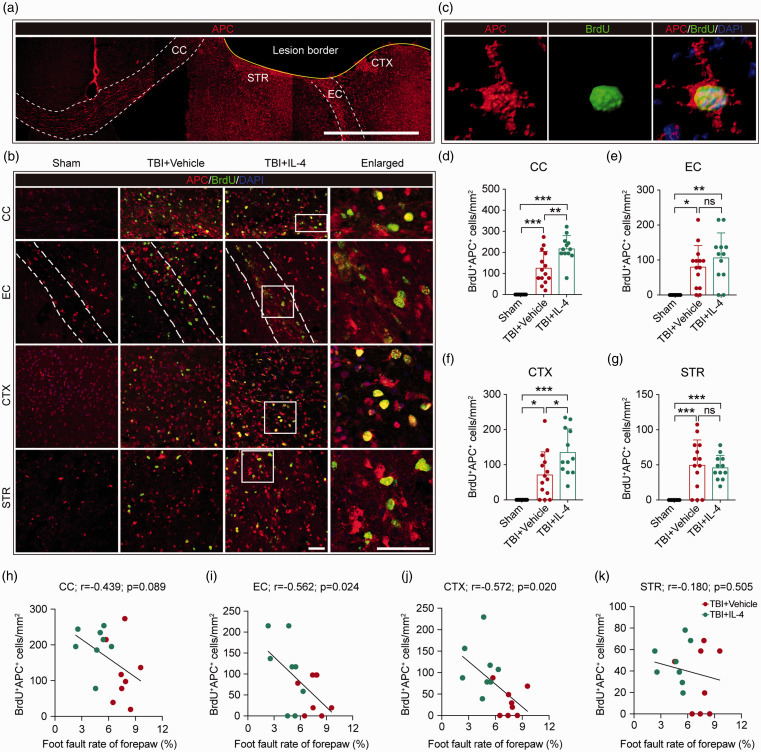
Figure 5.
IL-4 treatment promotes oligodendrogenesis in peri-lesional areas after TBI in vivo. (a) Representative low-power images of APC immunostaining in the coronal plane. Scale bar = 500 μm. (b) Representative high-power images of BrdU and APC double immunostaining in the CC, EC, CTX, and STR at 35 days after TBI. Nuclei were stained with DAPI. Scale bar = 50 µm. The dotted white lines trace the boundaries of the EC. The white squares in the third column indicate where the enlarged images in the fourth column were captured. (c) Representative images showing a newly generated OL by 3D rendering with Imaris software. (d–g) Quantification of BrdU+APC+ cells in the CC, EC, CTX, and STR areas. *p< 0.05, **p< 0.01, ***p< 0.001, ns: no significance, by one-way ANOVA followed by Bonferroni post hoc. n = 8 in sham group, n = 14 in TBI+Vehicle group, n = 12 in TBI+IL-4 group. (h–k) Pearson correlations between the foot fault rate of the forepaw (%, foot fault test) and BrdU+APC+ cell counts in the CC, EC, CTX, and STR. n = 8 per group.

