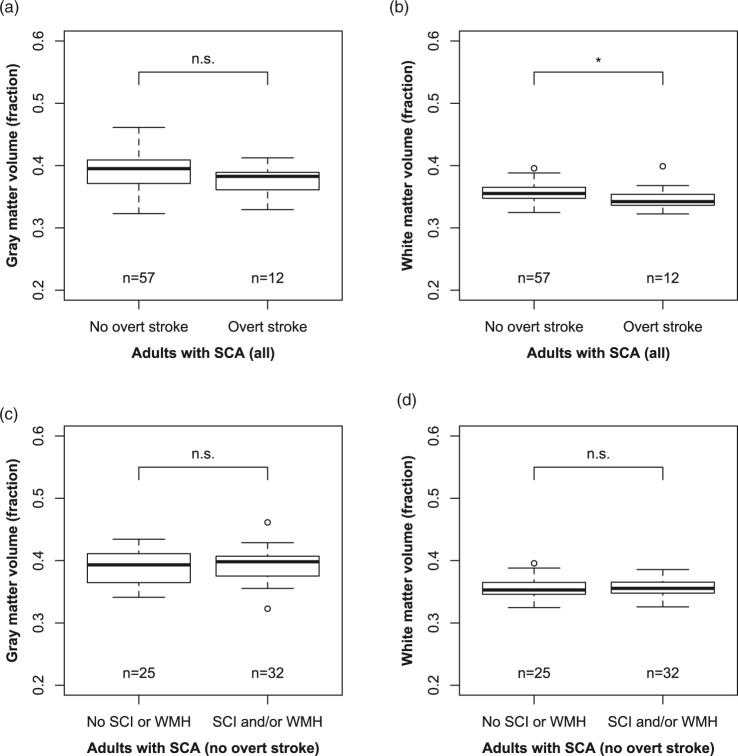
Figure 2.
Volumetrics and lesions: Box-and-whisker plots display the association between normalized gray matter volume (a, c), normalized white matter volume (b, d) and history of overt stroke (a, b) and history of silent cerebral infarcts (SCI) or white matter hyperintensities (WMH) (c, d). The central line represents the median, the box represents bounds for the 25th and 75th percentiles, and the lower and upper whiskers represent 1.5 times the interquartile range beyond the 25th and 75th, respectively. Data beyond the whiskers are represented with circles. Statistical results are presented from Wilcoxon rank-sum tests. *p ≤ 0.05, **p ≤ 0.01, and n.s. p > 0.05.

