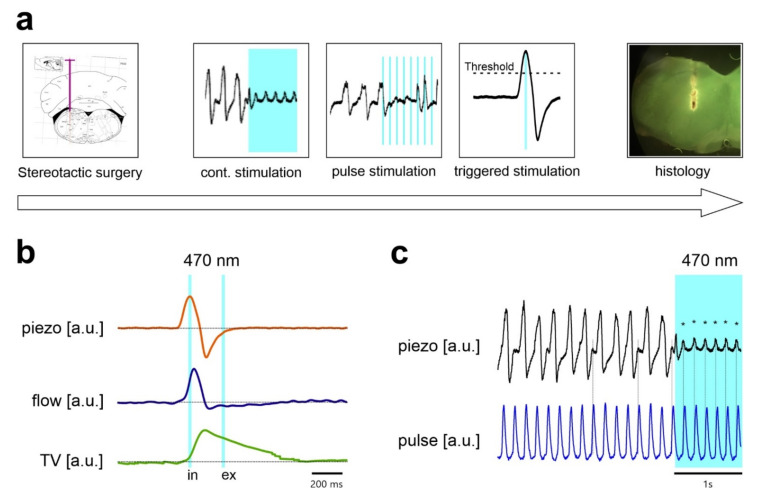
Figure 5.
Experimental design and breathing measurement in anesthetized mice. (a) Time line of the experiments. After stereotactic implantation, the optogenetic stimulation was performed, starting with continuous stimulation, over repetitive stimulation (frequency between 33 Hz and 3 Hz) to threshold triggered stimulation. The experiment was concluded by transcardial perfusion for histology. (b) In an independent set of experiments, the signal of the piezo transducer was compared with plethysmography. The transducer was placed on the thorax of the mouse (piezo) with simultaneous measurement by whole-body plethysmography (the mouse was anesthetized by isoflurane). Flow trace (blue) and integrated flow representing tidal-volume (TV; green). Data are averaged from 20 cycles. Vertical blue lines indicate the approximate time point of the triggered light pulse. (c) Breathing movements (inspiration upward) detected by the piezo transducer. The piezo transducer also detects the beat of the heart (*), which becomes evident when breathing is suppressed by continuous activation of inhibitory neurons. Heart beats are synchronous with the signal output (blue trace) of the pulse oximeter.

