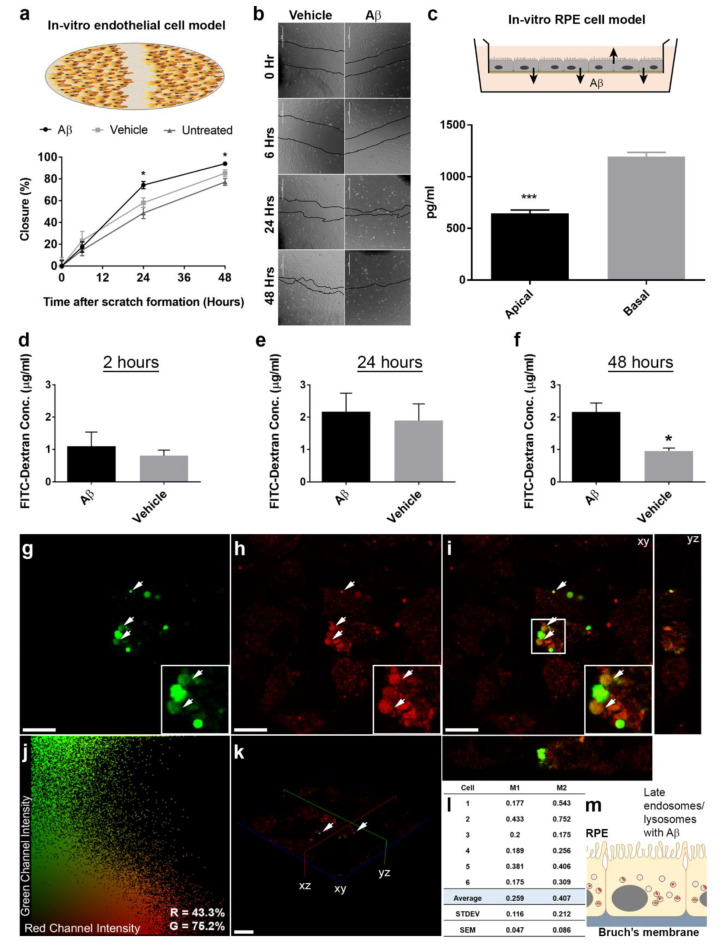
Figure 5.
Human oligomeric Aβ1-42 directly targets choroidal endothelial and RPE cells. (a) The consequences of Aβ exposure on choroidal endothelial cells were studied using a scratch assay. (b) Representative bright filed images showing closure of the scratch between 0, 6, 24 and 48 h after treatment with either 1 μM of human oligomeric Aβ1-42 or vehicle. Exposure to Aβ resulted in a significantly rapid closure of the scratch at 24 and 48 h compared to vehicle or untreated controls (n = 4). One-way ANOVA with Tukey’s multiple comparisons test, where * denotes a significance of p ˂ 0.05. (c) As the RPE is a major source of retinal Aβ, we next quantified total soluble Aβ1-x levels in an in vitro model. Significantly higher amounts of Aβ was preferentially secreted via the basolateral RPE surface compared to Aβ levels secreted apically (n = 3 from 3 independent experiments). Unpaired Student’s t-test, where *** denotes a significance of p ˂ 0.001. To determine whether exposure to elevated Aβ impaired integrity of the RPE barrier, we quantified the passage of a FITC-dextran substrate from the apical to the basal Transwell chamber at (d) 2 h, (e) 24 h and (f) 48 h. Exposure to 1 μM human oligomeric Aβ1-42 resulted in a markedly increased paracellular permeability at 48 h compared to vehicle-treated controls (n = 3). Mann–Whitney U test where * denotes a significance of p ˂ 0.05. Next, we studied whether exposure to Aβ resulted in its internalization by RPE cells. Representative confocal micrographs showing (g) Alex Fluor 488-tagged Aβ1-42 (green) with (h) LysoSensor DND-160 (red) (i) co-localizing in merged en face image (yellow: in white arrows) 24 h after Aβ exposure. Orthogonal views are shown alongside. Scale bars correspond to 40 μm. (j) Representative 2D scatter plot (cell 2 in (l)) generated by Costes analysis where thresholds are indicated in black along an axis providing a qualitative indication of co-localization. Manders split coefficients are shown in the bottom right. (k) 3D projection of cultured RPE cells showing Alex Fluor 488-tagged Aβ1-42 in green co-localizing with LysoSensor probe in red. Scale bar corresponds to 40 μm. (l) Costes overlap coefficients M1 and M2 indicating percentage of red co-localizing with green, and green co-localizing with red, respectively. Therefore, ~26% (0.259) of lysosomes were positive for Aβ, whilst 40.7% (0.407) of the Aβ signal co-localized to lysosomes. Measurements in n = 6 cells across three fields of view. Quantification was performed using Volocity software. (m) Schematic showing late-endocytic perinuclear compartments in RPE cells, which were labelled with Aβ1-42 in these experiments.

