Figure 7.
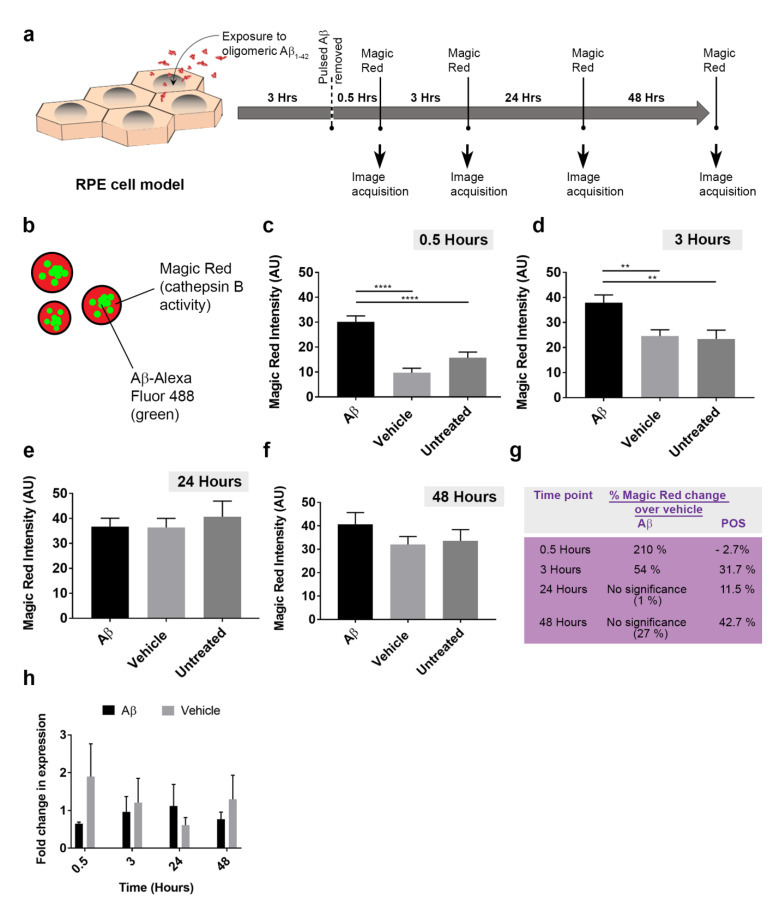
The cellular response to Aβ cargos in RPE lysosomes and transcriptional assessment of cathepsin B activity. (a) Schematic showing experimental plan where cultured RPE were exposed to 1 μM oligomeric Aβ1-42 for 3 h, following the removal of which Magic Red was used to obtain readouts of lysosomal cathepsin B activity at different time points. (b) Schematic showing arrangement of fluorophores in experiment where Aβ-Alexa Fluor 488 (green) and Magic Red (cathepsin B enzymatic activity) can be simultaneously quantified. Time course showing intensity of Magic Red fluorescence at (c) 0.5 h, (d) 3 h, (e) 24 h and (f) 48 h following exposure to Aβ, vehicle or untreated controls. Significant differences were observed in Magic Red intensity between Aβ vs. vehicle-treated controls as well as untreated sister cultures at 0.5 and 3 h, which diminished thereafter to baseline levels. n = 40 for Aβ1-42, vehicle and n = 30 for untreated cultures across four biological replicates (10 images analyzed per treatment/experiment). Kruskal–Wallis with Dunn’s multiple comparisons where ** denotes a significance of p ˂ 0.01, whilst **** indicate p ˂ 0.0001. (g) A summary table showing Magic Red activity in response to Aβ cargo as a percentage change over vehicle, compared to responses for POS cargo. (h) Quantitative PCR analysis of cathepsin B (CSTB) mRNA expression in relation to the EIF4A2 reference gene as fold change in expression, n = 3. No significant differences in cathepsin B mRNA levels were detected between Aβ-treated vs. vehicle or untreated cultures.

