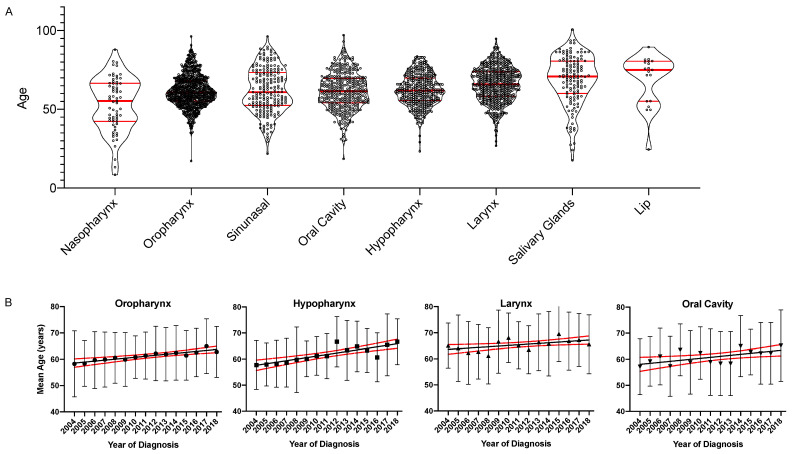
Figure 4.
Grouped scatter plots and linear regression of age and year of diagnosis separated by the primary tumor site. (A). The mean age of patients diagnosed from 2004 to 2018 by primary tumor site is graphed on the left y-axis as a violin plot showing all individual values. Patient subgroups were ordered by the median age. Median and quartiles are indicated by red horizontal bars. (B). The mean age ± standard deviation for the most prevalent four primary tumor sites (oropharynx, hypopharynx, larynx and oral cavity) is graphed on the y-axis over time on the x-axis. The lines indicate the linear regression model and the broken lines the upper and lower 95% confidence interval.

