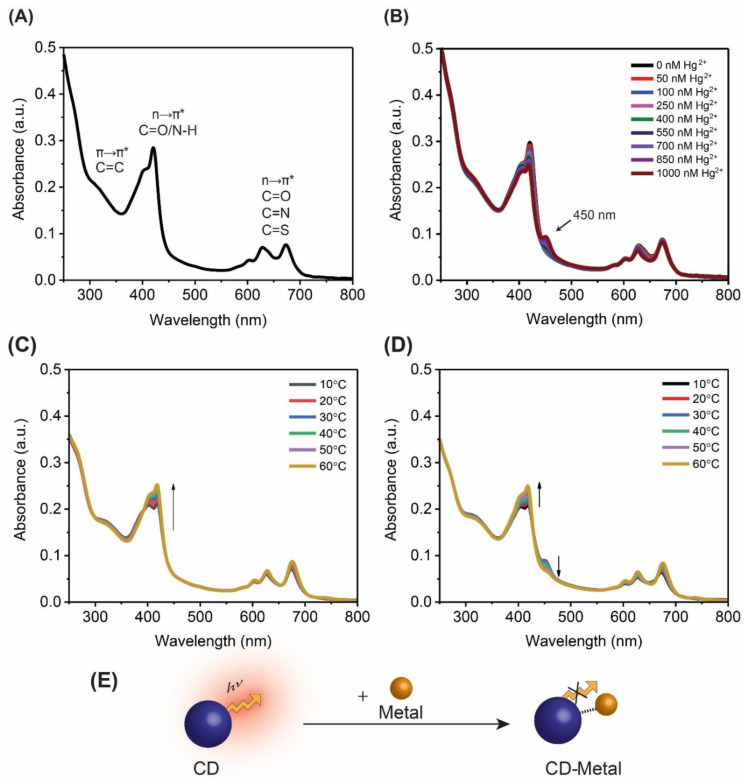
Figure 2.
Absorbance spectra for FG-CDs (A) alone, (B) showing a new peak at ~450 nm in the presence of Hg2+. Absorbance spectra of FG-CDs showing changes as a function of increasing temperatures (C) with 0 nM of Hg2+ and (D) with 1000 nM of Hg2+. (E) Graphical illustration of CD fluorescence quenching upon binding to a metallic cation.

