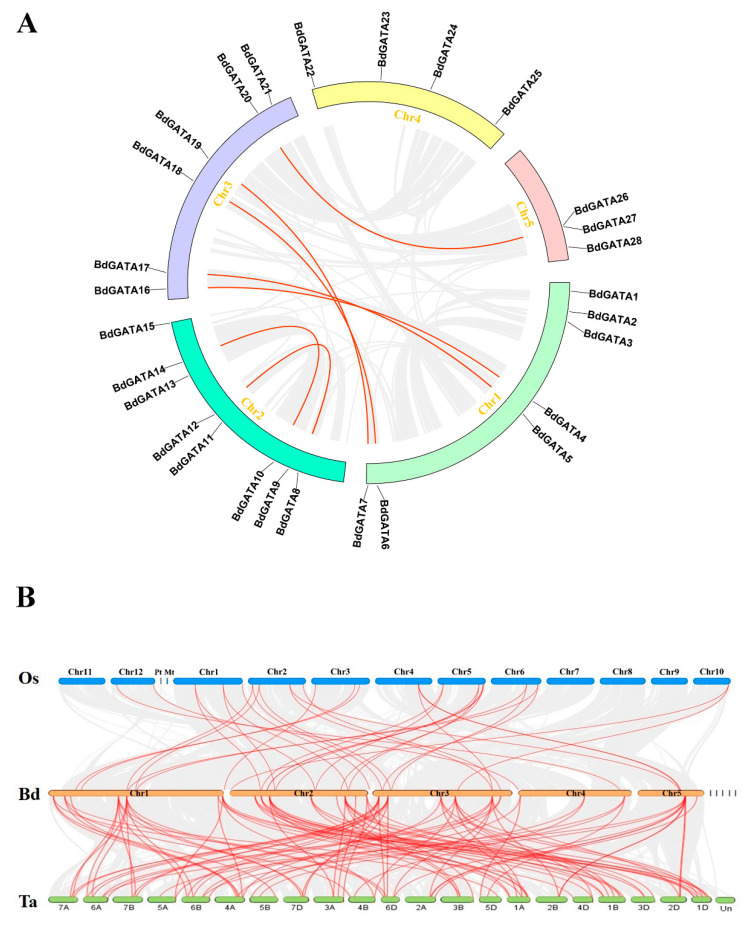
Figure 3.
Duplication pairs and synteny analysis of GATA genes between Brachypodium distachyon and rice/wheat. (A) Each chromosome is represented with a different color. Gray curves denote the details of syntenic regions in Brachypodium distachyon genome and red curves denote BdGATA gene pairs with segmental duplication. (B) Red lines indicate homologous genes between Brachypodium distachyon and rice/wheat chromosomes.

