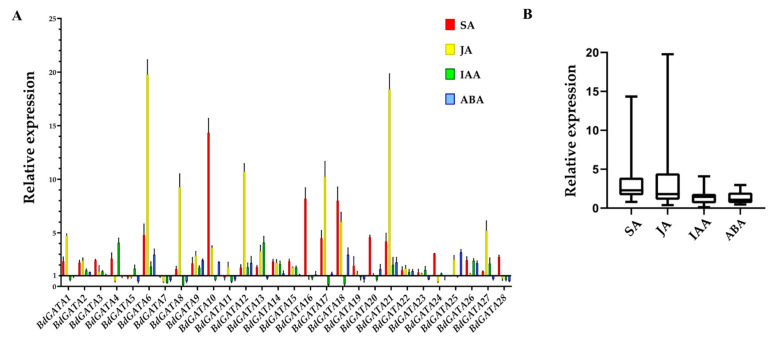
Figure 7.
Expression profiles of BdGATA genes with phytohormone treatments. (A) Fold change in expression of BdGATA genes after hormone treatments. Fold change in BdGATA gene expression after hormone treatments assessed by qRT-PCR of cDNA isolated from hormone treatment plants were compared with mock treatment plants. Fold change of 1 means no difference in gene expression between hormone treatment plants and mock treatment plants. This assay was repeated three times with similar results. (B) Box–whisker plot of BdGATA gene expression after phytohormone treatments. The y-axis represents relative gene expression level. Whiskers represent maximum/minimum values, boxes indicate the first quartile and third quartile, and the horizontal line represents the median.

