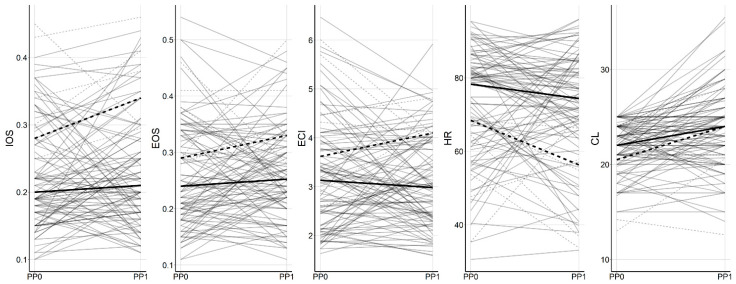
Figure 3.
Preprogesterone and postprogesterone changes in elastographic parameters. Solid and dashed lines represent the mean value of the groups of delivery ≥32 weeks and delivery <32 weeks, respectively. IOS, mean of internal os strain; EOS, mean of external os strain; ECI, elasticity contrast index; HR, hardness ratio; CL, cervical length; PP0, preprogesterone; PP1, 1 week postprogesterone.

