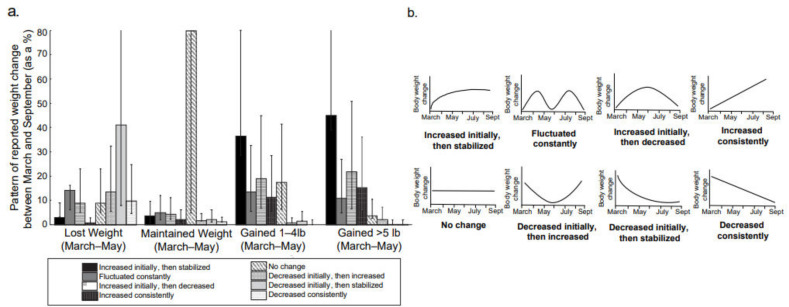
Figure 1.
Pattern of Reported Weight Change Between March and September. (a) Percent of participants reporting patterns of body weight fluctuation across weight risk groups. (b) Options of patterns presented to participants to describe their weight change between March and September. Error bars represent 95% Confidence Interval.

