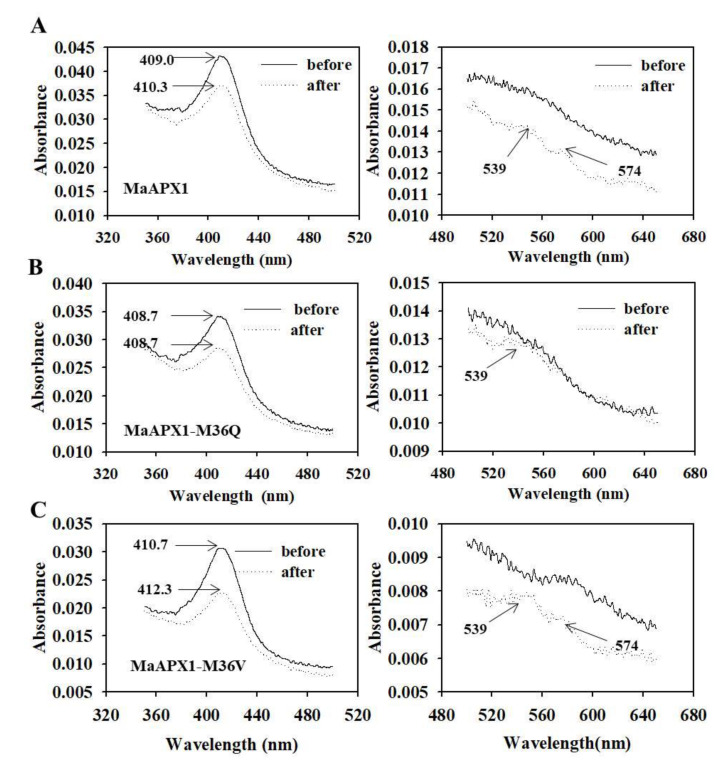
Figure 6.
Absorption spectra of MaAPX1, MaAPX1-M36Q, and MaAPX1-M36V before and after H2O2 addition. (A) MaAPX1; (B) MaAPX1-M36Q; (C) MaAPX1-M36V. Left, spectra from 500 to 650 nm. Arrows indicate the Soret peak of the resting enzyme after the H2O2 reaction. Spectral shifts of the Soret peak are indicative of compound I-like formation. Right, spectra from 500 to 650 nm.

