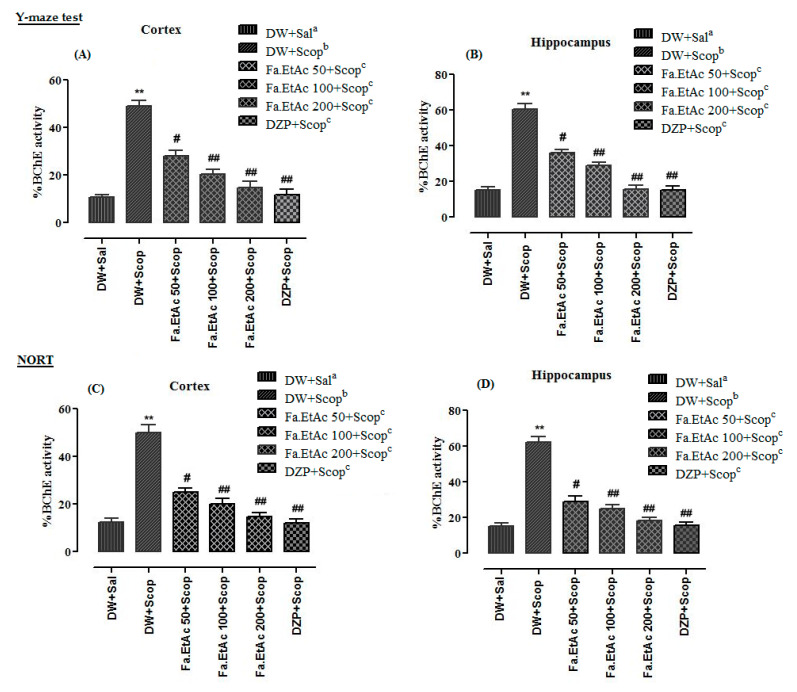
Figure 7.
Ex vivo % BChE activity in the (A) frontal cortex and (B) hippocampus of different animal in Y-maze behavioural task and (C,D) NORT. The data are expressed as Mean ± SEM; each value corresponds to a mean of eight animals. One-way ANOVA followed by Dunnett’s post hoc multiple comparison test to determine the values of p. ** p < 0.01; comparison of DW + Sala (Normal control) vs. DW + Scopb (Scopolamine treated), # p < 0.05 and ## p < 0.01; comparison of (DW + Scop)b vs. DZP + Scopc (Donepezil treated) and Fa.EtAcc (50, 100 and 200 mg/kg)-treated groups), ns: values not significantly different in comparison to (DW + Scop)b-treated group using one-way ANOVA followed by Dunnett’s post hoc multiple comparison test.

