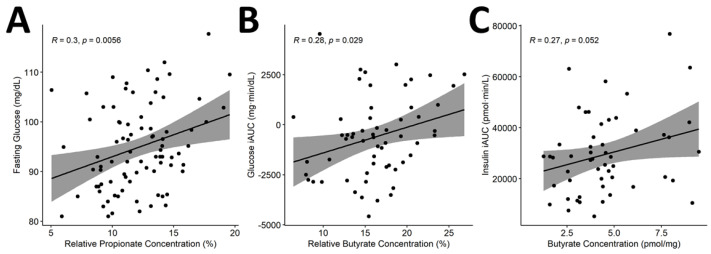
Figure 9.
Correlation of SCFAs with glycemic response. Pearson’s correlation showed significant correlations between (A) propionate and fasting glucose as well as between butyrate concentrations and (B) glucose iAUC and (C) insulin iAUC. Relative concentration defined as proportion of total SCFA concentration. Abbreviations: incremental area under the curve (iAUC); short-chain fatty acids (SCFAs).

