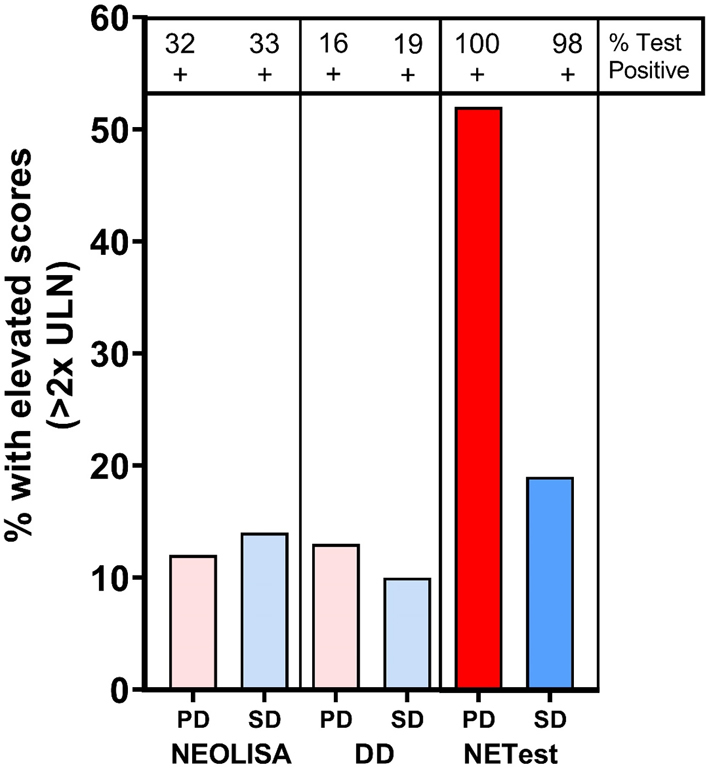
Figure 4.

Stable vs progressive disease status identification. Analysis of percentage subjects with assay levels <2× ULN with comparison between PD (n = 25) and SD (n = 98). Similar proportions of patients exhibited elevated CgA levels irrespective of disease status. For NEOLISA this was 12–14% and for DD it was 10–13% (P = NS). For the NETest, significantly more PD exhibited elevated levels than SD (Chi2 = 9.4, P = 0.002). PD, progressive disease; SD, stable disease; ULN, upper limit of normal.

 This work is licensed under a