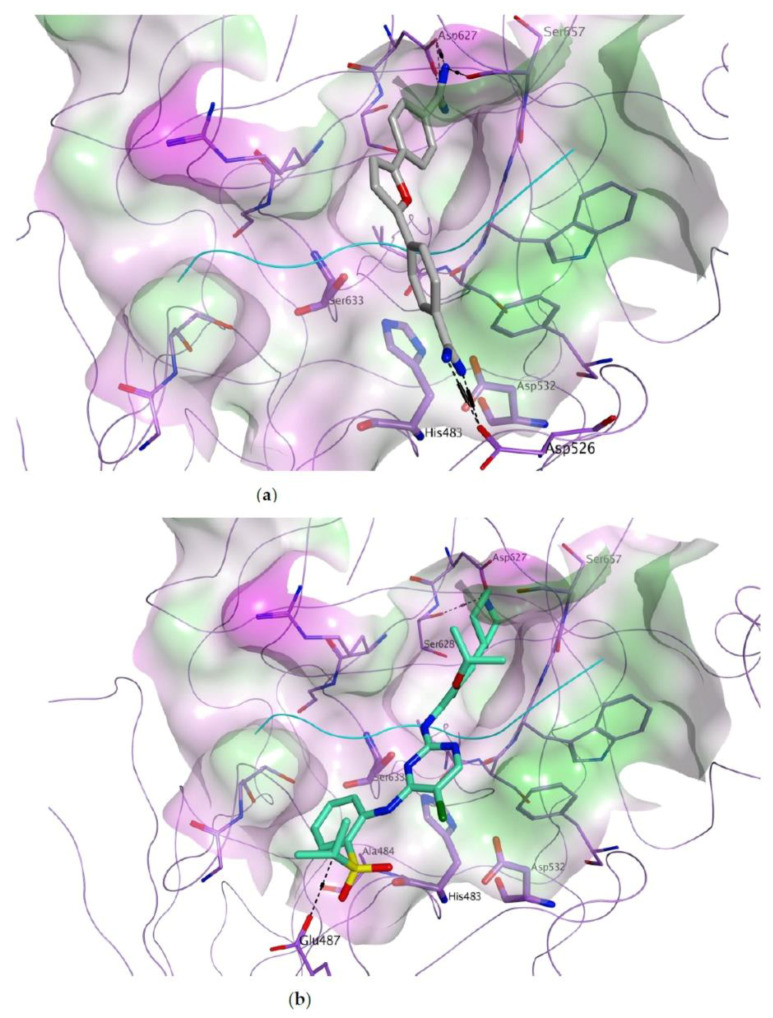
Figure 8.
Predicted binding of furamidine ((a), carbon atoms in grey) and ceritinib ((b), carbon atoms in green) to the active site of MASP-2. The catalytic site is represented as molecular surface, colour-coded according to lipophilicity (green = lipophilic, pink = hydrophilic, white = neutral). MASP-2 is represented as lilac ribbon, with carbon atoms for the residues shown in lilac. The reference peptide inhibitor is shown as cyan ribbon.

