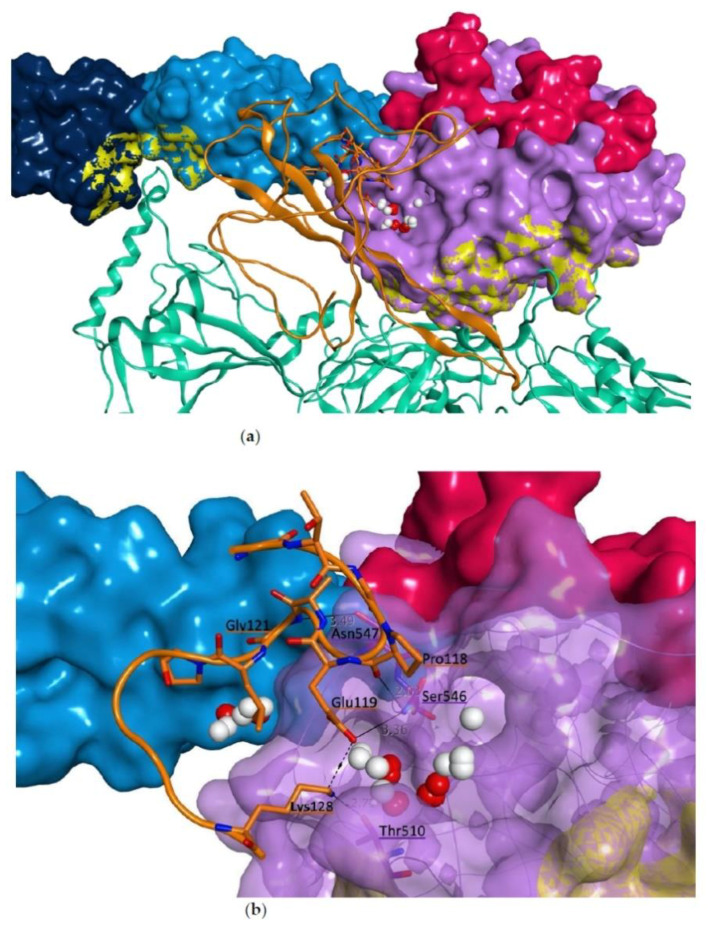
Figure 11.
Protein-protein docking model between MASP-2 and SARS-CoV-2 N protein (orange ribbon) chosen for structural optimization by molecular dynamics: (a) overall overview of the binding mode, and (b) zoom on the predicted interaction site of the N protein interacting sequence (only residues 115-123 are shown, with carbon atoms in orange and orange ribbon, along with Lys128). MASP-2 domains are represented as molecular surface: CCP1 in dark blue, CCP2 in light blue and SP in lilac. C4 is represented as green ribbon. The druggable site at the interacting surface with the N protein is represented as white (hydrophobic interactions) and red (polar interactions) spheres.

