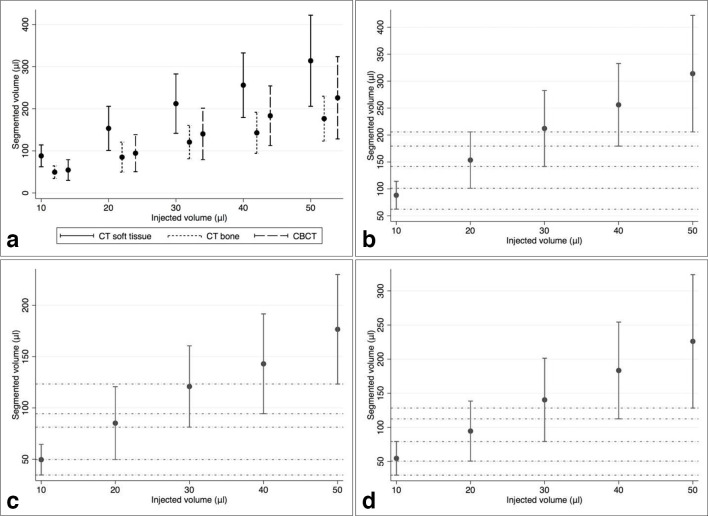
Figure 3.
(A) Overview of marker volumes segmented from CT and CBCT imaging and marker volumes segmented in (B) soft tissue kernel CT, (C) bone kernel CT and (D) CBCT. Dots are indicating mean values, vertical lines are indicating norm intervals and horizontal lines in B, C and D visualize difference in size between markers.

