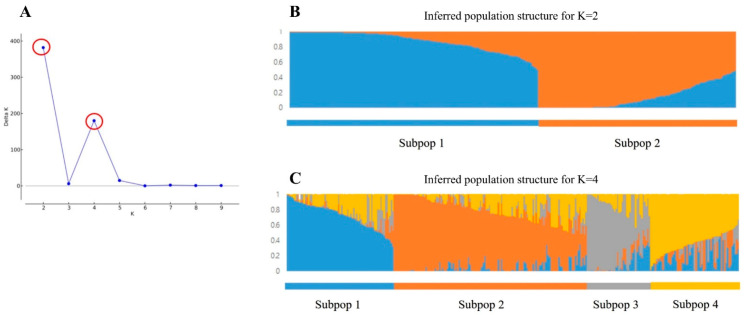
Figure 3.
Population structure analysis of 300 cucumber accessions using 151 single-nucleotide polymorphism (SNP) assay sets. Population structure determined using an admixture-based clustering model. (A) Plot of delta K values with K ranging from 2 to 10 in the STRUCTURE analysis. (B) Population structure analysis results of cucumber accessions with K = 2 and (C) K = 4. Each accession is represented by a vertical bar. Each color represents one ancestral population, and the length of each colored segment of each vertical bar represents the proportion contributed by ancestral populations.

