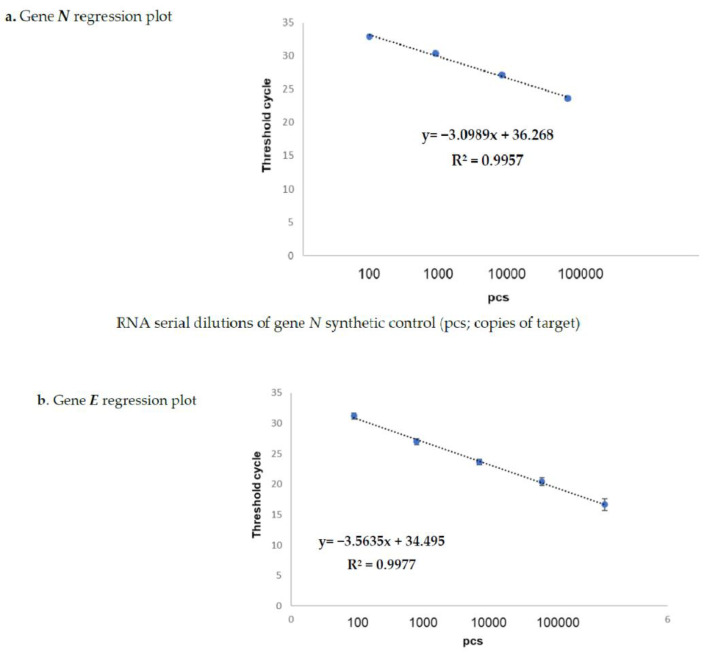
Figure 1.
Spike-in of genes N (a) and E (b) evaluated by Kit-A. Figures (a,b) show the regression plots regarding the correlation curves obtained by the real-time TaqMan PCR Kit-A on serial dilutions of both synthetic positive control (pcs; copies of target) genea N and E. The starting volume of the input RNA for the reverse transcription and qPCR (one step process) was 5 µL for each target. The RNA amounts corresponding to each titration point amplified by one-step RT-qPCR were 0.1 pg, 1 pg,10 pg, 100 pg, and 1 ng for both the N and E genes, respectively. The reference sequences for the primers are reported in Table 3.

