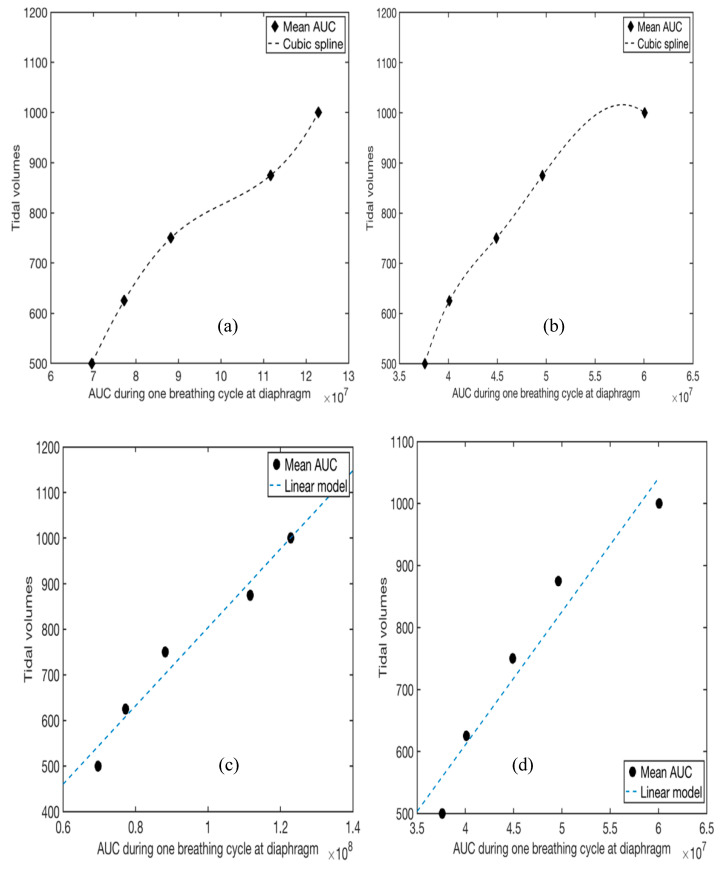
Figure 7.
Curve fitting. The y-axis represents the tidal volume and the x-axis represents the mean AUC values calculated from the EMG data (obtained at the diaphragm) for the different tidal volume during one breathing cycle. (a,b) Cubic spline interpolation. (a) subject 1 (male), (b) subject 2 (female); (c) Fitting a linear model to subject 1’s data at the diaphragm yields as the best fit line with 95% confidence bounds (adjusted R2 = 0.96). Here represents the AUC during one breathing cycle obtained at the diaphragm and represents the tidal volume. (d) Fitting a linear model to subject 2’s data at the diaphragm yields as the best fit line with 95% confidence bounds (adjusted R2 = 0.92).

