
Figure 2.
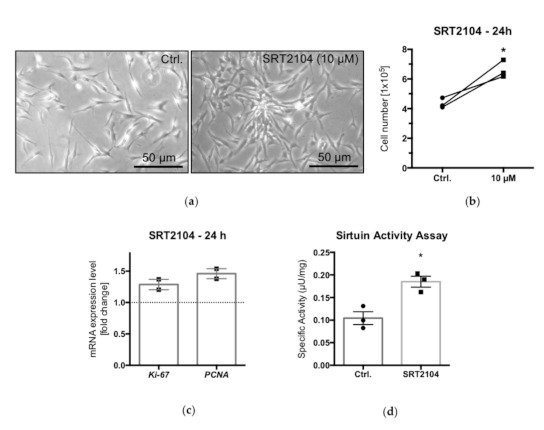
Live cell images of cultured KGN, under control conditions (Ctrl) and upon treatment with the SIRT1 activator SRT2104 (10 µM) for 24 h: higher cell density in the SRT2104 group (a). Bars indicate 50 µm. The measurement of cell numbers after SIRT1 activator treatment showed significantly increased cell numbers (b) (n = 3; * p < 0.05, paired t-test). Results of qPCR measurements of known proliferation markers, Ki-67 and PCNA; results are normalized to control conditions (c). Bars indicate means and SEMs (n = 2). Results of a SIRT activity assay revealed significantly increased deacetylation activity upon SIRT1 activator (10 µM) treatment (d) (n = 3; * p < 0.05, unpaired t-test).