
Figure 5.
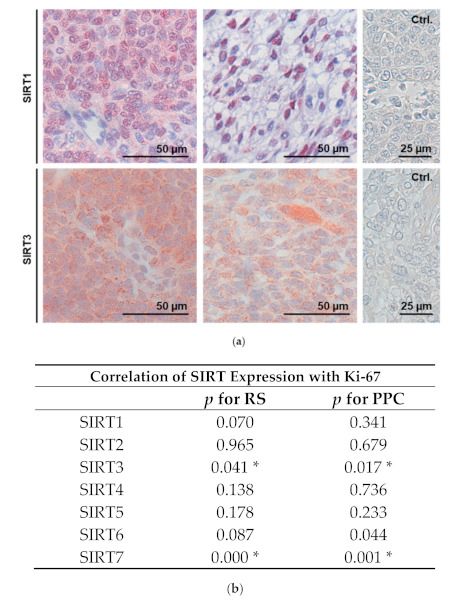
Immunohistochemical staining of SIRT1 and SIRT3 in GCTs (a). SIRT1 could be detected in the cytoplasm (left) and/or the nucleus (right), while SIRT3 staining pattern was punctured and found only in the cytoplasm (Ctrl., omission of first antibody). (b) Correlation of SIRT expression with proliferation (Ki-67) was calculated for both Remmele scores (RSs) and percentages of positive cells (PPCs). Results of the chi-square test are given, and * p < 0.05 was assumed to be significant. Note that for SIRT3 and SIRT7, a higher expression correlated with a higher Ki-67 expression (for evaluation of RS and PPC for calculating the correlation of SIRT1–7 expression with proliferation (Ki-67), see Supplementary Table S2).