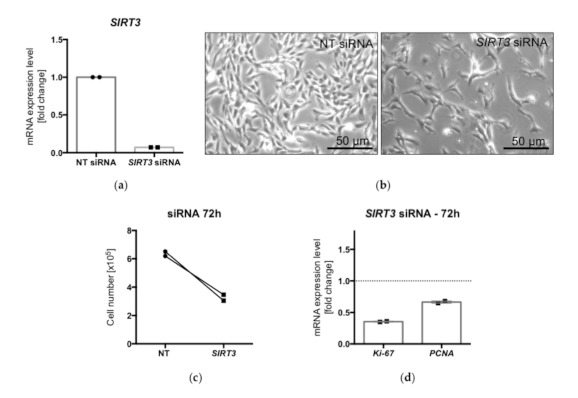
Figure 7.

The levels of SIRT3 were reduced after siRNA silencing of SIRT3 compared to NT siRNA controls (n = 2) (a). Live cell images of cultured KGN, under control conditions (nontarget = NT siRNA) and after siRNA silencing of SIRT3 (b). Lower cell counts after transfection (c) and reduced levels of the proliferation markers Ki-67 and PCNA (d) (n = 2).
