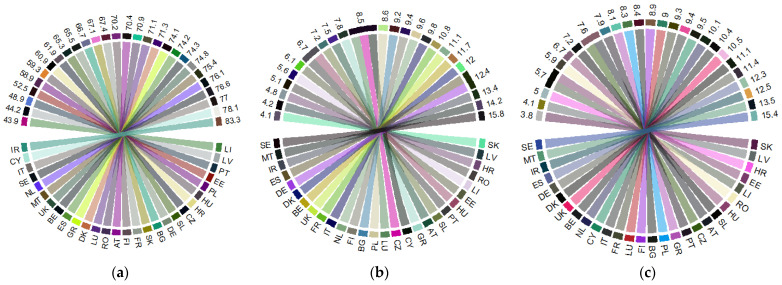
Figure 2.
Health indicators in the EU in 2017: (a) “Share of people aged 16+ with good or very good perceived health” (%) (PGPH); (b) “Healthy life years in absolute value at 65—females (years)” (HLY_F); (c) “Healthy life years in absolute value at 65—males (years)” (HLY_M). Source: own process in R version 3.6.3. (R Foundation, Free Software Foundation’s GNU General Public License, Boston, USA), based on Eurostat data [18]. Legend: AT—Austria; BE—Belgium; BG—Bulgaria; HR—Croatia; CY—Cyprus; CZ—Czech Republic; DK—Denmark; EE—Estonia; FI—Finland; FR—France; DE—Germany; GR—Greece; HU—Hungary; IR—Ireland; IT—Italy; LV—Latvia; LI—Lithuania; LU—Luxembourg; MT—Malta; NL—the Netherlands; PL—Poland; PT—Portugal; RO—Romania; SE—Sweden; SK—Slovak Republic; SL—Slovenia; ES—Spain; UK—United Kingdom. Value range: (a) 43.9–83.3 (%); (b) 4.1–15.8 (years); (c) 3.8–15.4 (years).

